
Figure 2.
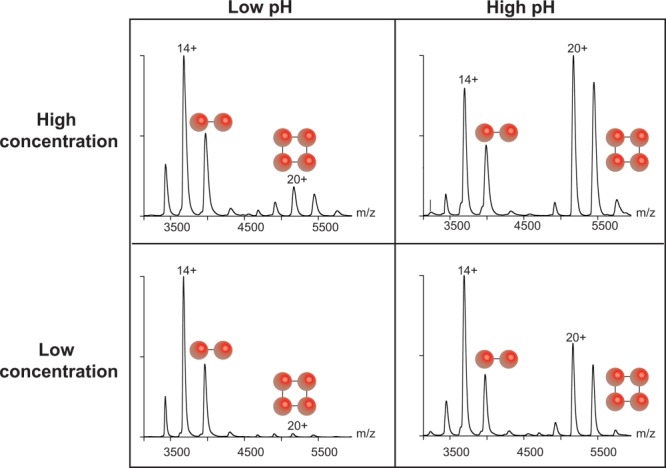
Solution conditions influence the species detected by native MS in the gas phase. The solution pH and sample concentration affect the relative abundance of dimers and tetramers of the protein concanavalin A. Spectra of intact concanavalin A are shown at the following concentrations and pH values (clockwise from top left): 18.3 μM and pH 3.4; 16.9 μM and pH 8.4; 2.0 μM and pH 8.4; and 2.1 μM and pH 3.4. Two spheres indicate the dimeric ions and four spheres indicate tetrameric ions. These spectra were reproduced with permission from Ref. 5, ©(2011) ACS publications.