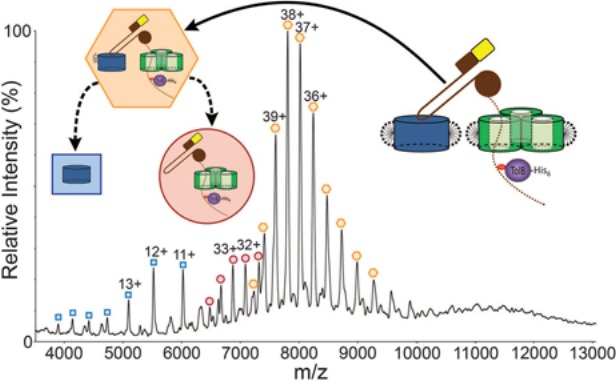
Figure 5.

Native mass spectrum of the ColE9 translocon. The inserts represent the observed species: orange hexagon, intact complex bound to a lipopolysaccharide; red circle, translocon lacking BtuB and the lipopolysaccharide; blue square, BtuB. See text for further details. This spectrum was reproduced with permission from Ref.108 © (2013) AAAS.
