
Figure 5.
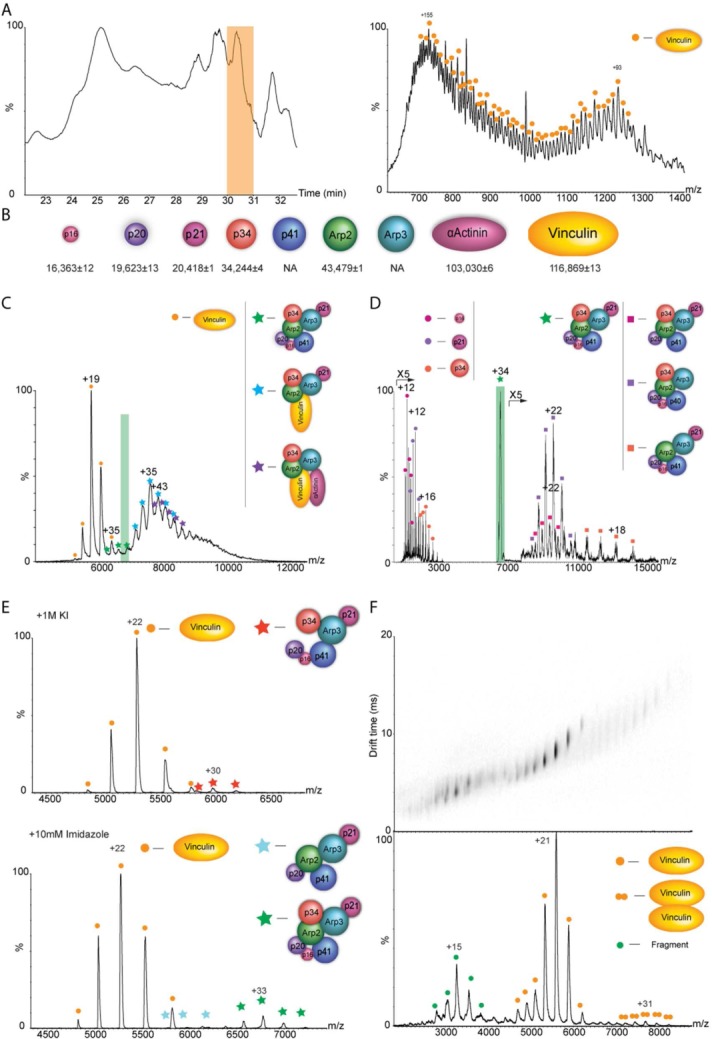
The cytoskeleton protein vinculin forms hybrid complexes with components of the Arp2/3 actin polymerization complex as revealed by native MS analysis. Cytoskeleton-related complexes from chicken gizzard smooth muscle were subjected to purification by stepwise ammonium sulfate precipitation, gel filtration, and anion exchange columns. The fraction that contained vinculin, α-actinin, and all seven subunits of the Arp2/3 protein complex, based on proteomic MS analysis, was further characterized by native MS. (A) Initially, the precise mass of protein components was determined by using a monolithic column-based approach in which protein constituents were separated prior to MS on an LC system using a monolithic column under denaturing conditions. A small portion of the flow was directed online into the mass spectrometer, for mass measurements of intact proteins and the remaining flow was fractionated for subsequent proteomic analysis. A representative chromatogram of the LC separation is shown on the left in which the peak representing the elution of vinculin is highlighted in yellow. The resulting ESI-QTOF mass spectrum of vinculin is shown on the right. (B) This approach together with MS/MS analysis enabled us to relate the specific subunit sequences with intact masses of almost all proteins within the sample as shown in the diagram. (C) Mass spectrum of the selected fraction recorded under native conditions. The predominant species detected, within the m/z range 5000–6800, is assigned to monomeric vinculin. Additional charge states, which correspond in mass to three coexisting protein complexes, are observed between m/z of 7000 and 11,000. The masses of these complexes indicate the presence of intact Arp2/3, a vinculin-associated Arp2/3 complex, and a vinculin-α actinin-associated Arp2/3 complex. (D) Validation of the complexes’ composition was undertaken by means of MS/MS; an example of a selected charge states is shaded in purple (D). The isolated peak is labeled with a star. Circles denote the released subunits and squares correspond to the remaining stripped complex. The MS/MS spectrum shows the dissociation products of ions isolated at m/z of 6917. Charge states above m/z of 7000 correspond to “stripped” Arp2/3 complexes. Individual Arp2/3 subunits, p16, p21, and p34 are observed at the low m/z values. (E) To enhance the structural characterization, subcomplexes were generated by manipulating the pH, increasing the ionic strength, or adding organic solvents to the buffer and subsequently acquiring MS and MS/MS data. Here, we show the effects of adding either 1M of KCl (top panel) or 10 mM of imidazole (bottom panel) to the sample and measuring the corresponding MS data. (F) To examine the topology of vinculin dimers, the recombinant protein was subjected to IM analysis. The figure shows the two-dimensional IM-mass spectrum with the corresponding line-projections in the m/z dimension. Adjusted with permission from Chorev DS, et al., Nat Commun, 2014, 5, 3758.