
Figure 2.
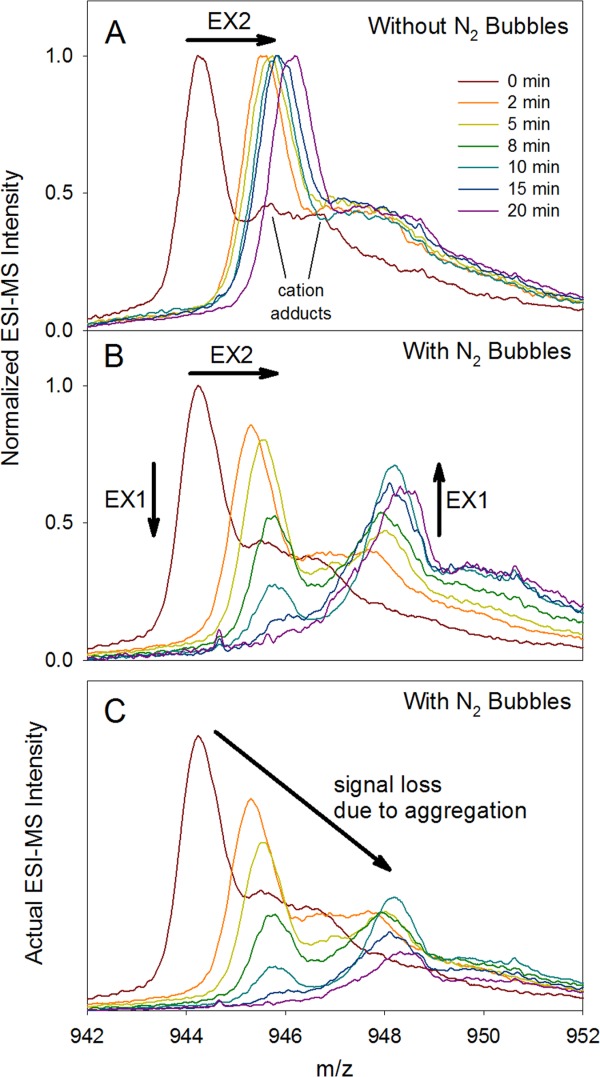
Mb mass spectra recorded at different HDX time points in the absence (A) and in the presence (B), (C) of N2 bubbles. The data shown here correspond to the 18+ charge state. Time-dependent shifts in peak maxima (EX2 behavior) are highlighted in panels A, B using arrows. In addition, for panel B time-dependent changes in the relative intensity of high mass vs. low mass component (EX1 behavior) are emphasized. The spectra in (B) were normalized such that each time point represents the same integrated intensity. (C) The same data as in panel B, but with actual intensities that reflect the time-dependent decrease in overall signal due to aggregation. Unresolved cation adducts are highlighted for the t = 0 spectrum in panel A.