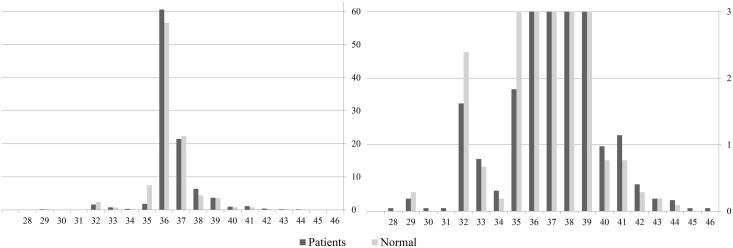
Fig 1. Distribution of CAG/CAA repeats in the TATA-binding protein gene in normal controls and patients.
Patients are shown as dark colored bar and normal control as light colored bar. Y axis represents the percentage of each allele. Left panel shows the whole distribution, while right panel focused on repeats with low percentage by limiting the y axis to 3 percent.

