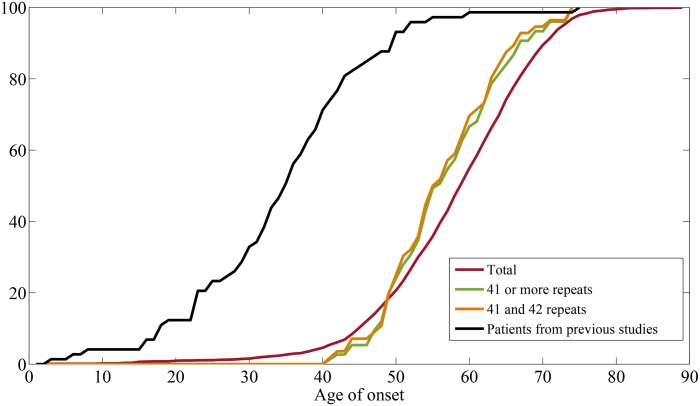
Fig 2. Distribution of the cumulative age of onset in patients.
Forty-one or more repeats as well as 41 and 42 repeats showed a left shifted cumulative distribution compared to the total population, which was statistically significant by two-sample Kolmogorov-Smirnov test (p <0.001). The black line shows the patient populations collected from previous studies showing an earlier onset age compared to the total population from this study. (p<0.001)

