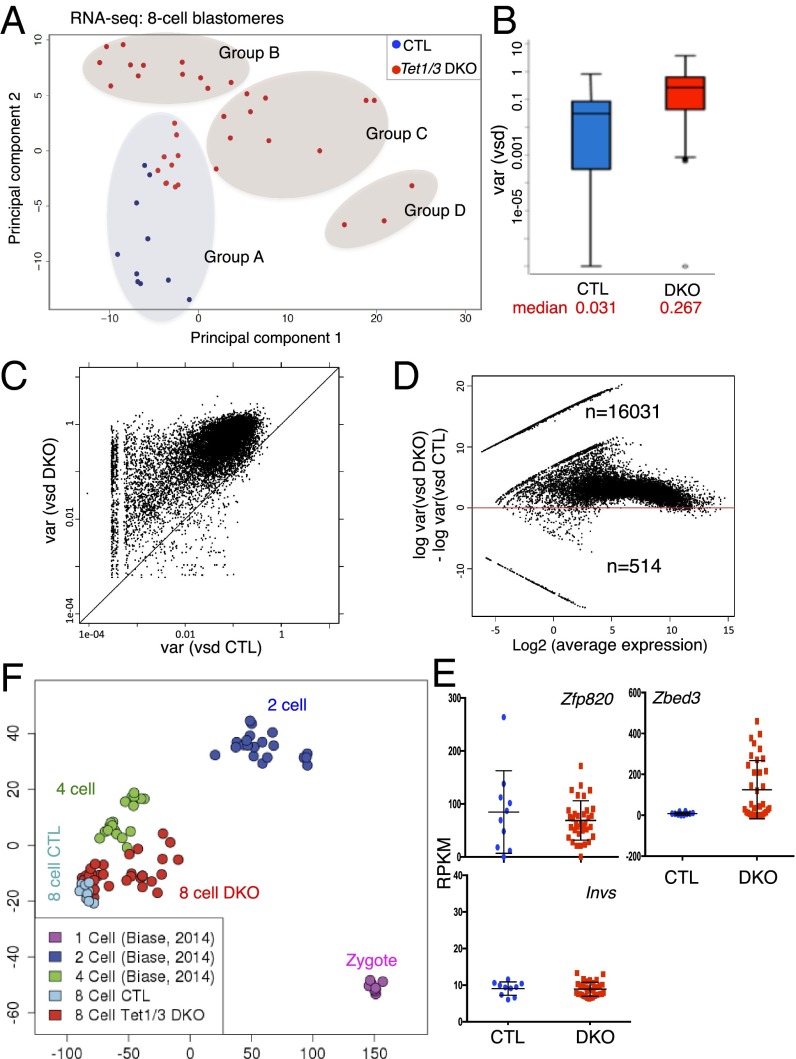
Fig. 2.
Transcriptional variability associated with Tet1/3 deficiency revealed by single-cell RNA sequencing of individual blastomeres from eight-cell embryos. (A) Principal component analysis of the transcriptomes of 10 CTL and 35 Tet1/3 DKO with the sex chromosome information removed, showing that the 35 Tet1/3 DKO blastomeres are more widely separated than the 10 CTL blastomeres for both principal component 1 (PC1) (absolute gap, 37 vs. 8) and PC2 (17 vs. 13). Groups A–D identified by the clustering analysis of A are indicated. (B) The box-and-whisker plot depicts the distribution of stabilized variances (gene expression variances across samples independent of their expression strength; see Materials and Methods) in eight-cell embryos. Median variances are shown at Bottom. Upper and Lower whiskers represent >75% and <25%, respectively. (C) Correlation plot of expression variances of all genes expressed in single cells of CTL and Tet1/3 DKO eight-cell embryos. Each gene is represented by a dot. Most genes fall above the diagonal, indicating greater variability of expression in Tet1/3 DKO blastomeres compared with controls. (D) The ratios of gene expression variance between CTL and Tet1/3 DKO blastomeres are plotted against the average expression level for each gene. The increased gene expression variance observed in blastomeres from Tet1/3 DKO eight-cell embryos is independent of the level of gene expression. (E) The genes expressed with highest variance in CTL and Tet1/3 DKO blastomeres, Zfp820 (Left) and Zbed3 (Right), respectively, and a gene that shows low variance in both samples, Invs (Bottom), are indicated (also see SI Appendix, Fig. S4E). (F) Principal component analysis of the combined RNA-seq data from our study and the single-cell analysis of zygotes, two-cell, and four-cell embryos performed by Biase et al. (28).

