Fig. 4.
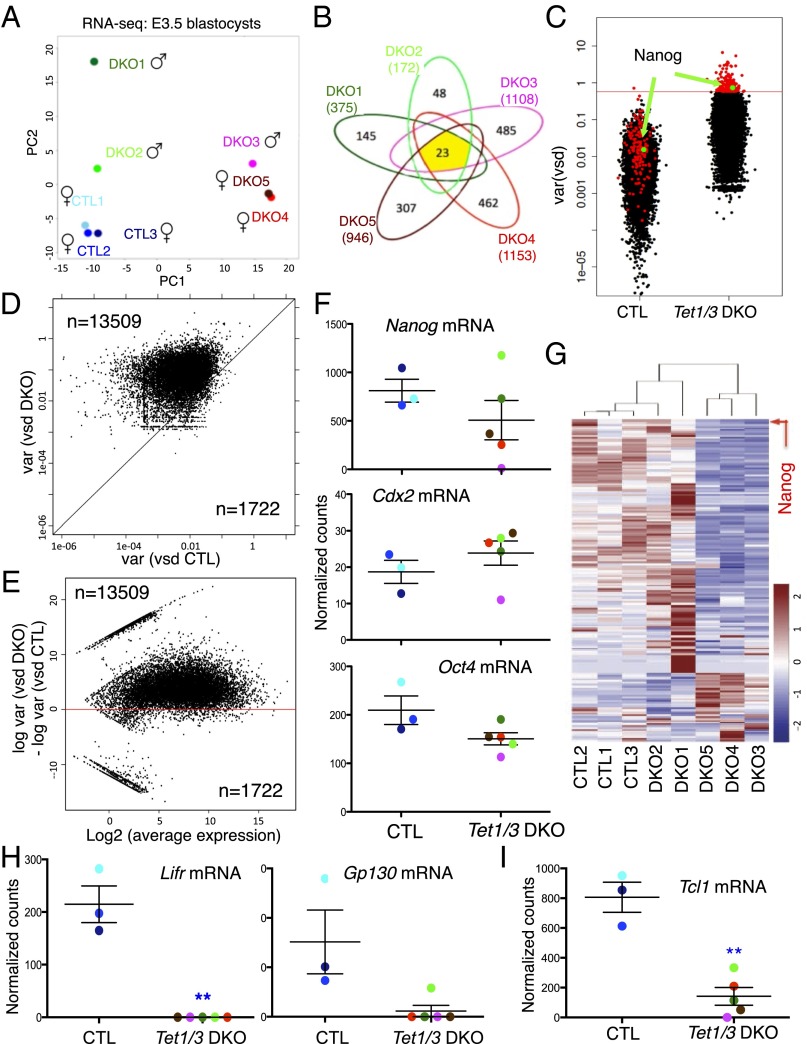
Transcriptional variability associated with Tet1/3 deficiency revealed by RNA sequencing of single E3.5 blastocysts. (A) Principal component analysis (PCA) of three CTL and five Tet1/3 DKO transcriptomes with the sex chromosome information removed, showing that the three control blastocysts cluster together, whereas the five Tet1/3 DKO blastocysts are widely separated. (B) Numbers of genes differentially expressed in each of the Tet1/3 DKO blastocysts compared with the average of the CTL blastocysts. Only 23 genes are differentially expressed in all five Tet1/3 DKO blastocysts relative to control blastocysts. (C) Overall increase in the variance of gene expression in Tet1/3 DKO compared with CTL blastocysts. Each gene is represented by a dot, with Nanog indicated in green. Genes shown in red are those with highest variance (top 1%, n = 178) in Tet1/3 DKO blastocysts. (D) Correlation plot of expression variances of all genes from CTL and Tet1/3 DKO embryos. Most genes fall above the diagonal, indicating greater variability of expression in Tet1/3 DKO blastocysts compared with controls. (E) The ratios of gene expression variance between CTL and Tet1/3 DKO blastocysts are plotted against the average expression level for each gene. The increased gene expression variance observed in Tet1/3 DKO blastocysts is independent of the level of gene expression. (F) Nanog, Cdx2, and Oct4 mRNA expression in control (CTL) and Tet1/3 DKO E3.5 blastocysts quantified by RNA-seq. (G) Heatmap showing expression of the top 1% of variable genes in Tet1/3 DKO blastocysts compared with controls. Nanog is indicated by an arrow. (H) Lifr, Gp130, and (I) Tcl1 expression levels in control (CTL) and Tet1/3 DKO blastocysts assessed by RNA-seq (**adjusted P value <0.01).

