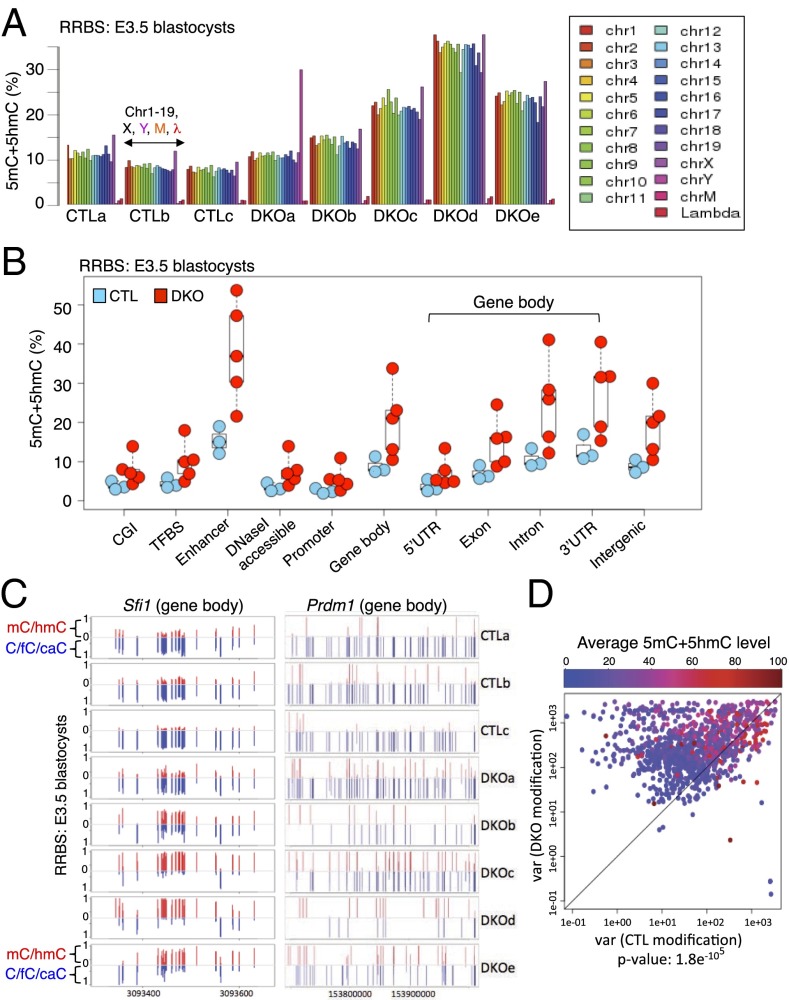
Fig. 5.
The variable levels of DNA modification (5mC+5hmC) in Tet1/3 DKO E3.5 blastocysts parallel the transcriptional variability observed above. (A) Modification levels on each chromosome were plotted for three CTL and five Tet1/3 DKO E3.5 embryos based on RRBS analysis. Note that the DKOa blastocyst is the only one with a Y chromosome and that cytosines in control unmodified lambda DNA show more than 98% conversion to T in all embryos. (B) The levels of DNA modification at CpG islands (CGI), transcription factor binding sites (TFBS), enhancers, DNaseI accessible regions, promoter (±2 kb relative to the TSS), gene bodies (subdivided into 5′ UTR, exon, intron, 3′ UTR) and intergenic regions. Each circle represents one blastocyst, with the embryo ID shown within each circle: blue circles, control blastocysts; red circles, Tet1/3 DKO blastocysts. (C) Modification levels of part of the gene body of Sfi1 and the entire gene body of Prdm16 from individual control and Tet1/3 DKO blastocysts. Each bar represents one CpG, and the full length of each bar represents 100% modification (red, 5mC+5hmC; blue, C+5fC+5CaC). (D) The correlation plot depicts variances in the DNA modification level of individual CpGs from CTL and Tet1/3 DKO embryos. Each dot represents one CpG (more than eight reads and >10% 5mC+5hmC). The level of DNA modification at each CpG is graded from blue to red. Most dots fall above the diagonal regardless of modification level, indicating thatTet1/3 DKO blastocysts show greater variability of DNA modification compared with controls.

