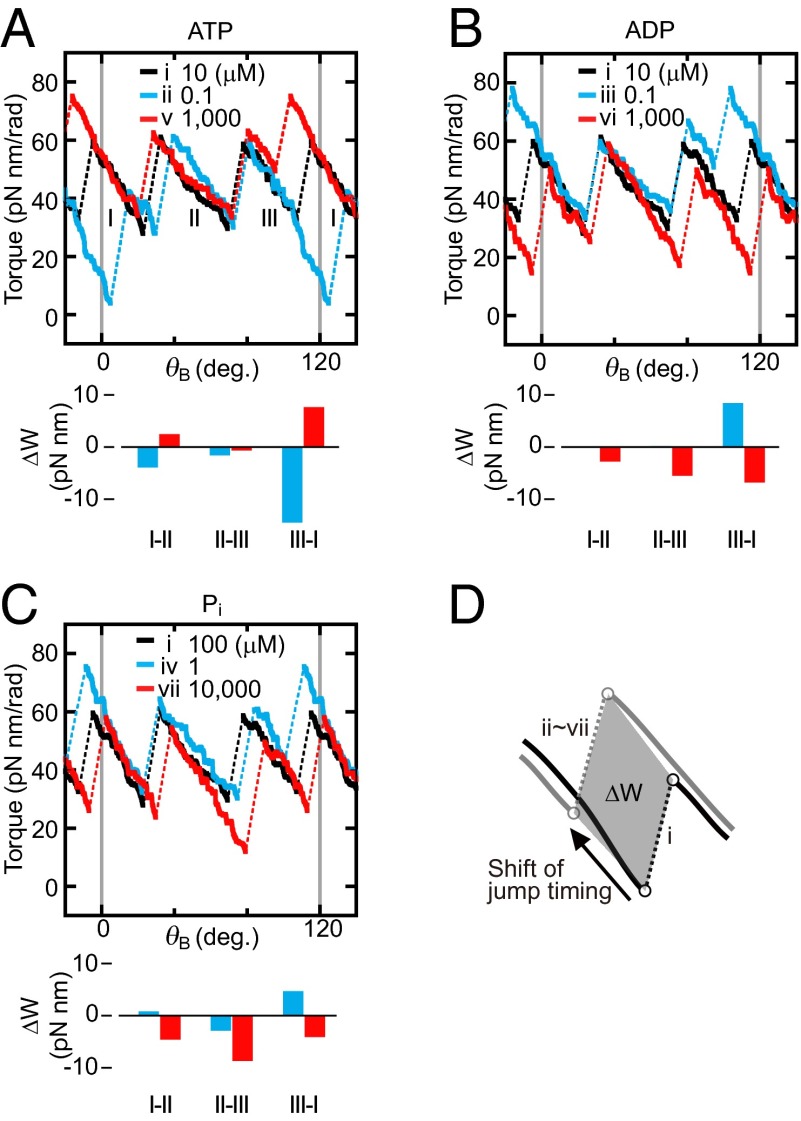
Fig. 3.
Torque profiles in the presence of different concentrations of (A) ATP, (B) ADP, and (C) Pi. Black lines are the torque profile of condition i (ATP = 10 μM, ADP = 10 μM, and Pi = 100 μM). Blue and red lines represent the torque profiles in 100-fold and 1/100-fold concentration of the indicated substrate, respectively. The areas sandwiched between torque profile of condition i and those of conditions ii–vii during the transition are obtained as illustrated in D. The areas are converted to the variations of the mechanical work (ΔW) generated from the shift of the transition timing and shown below each panel.

