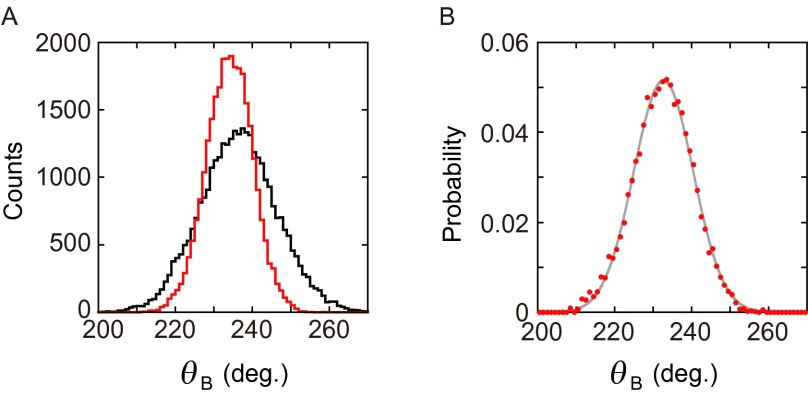
Fig. S9.
Estimation of the magnetic trap stiffness. (A) Angular distribution of a bead of inhibited state of F1 in the absence (black line) and presence (red line) of the magnetic trap. (B) Distribution difference between the black line and red line in A. This distribution was used to estimate the trap stiffness (Methods, Estimation of Trap Stiffness and the Trap Center Angle).

