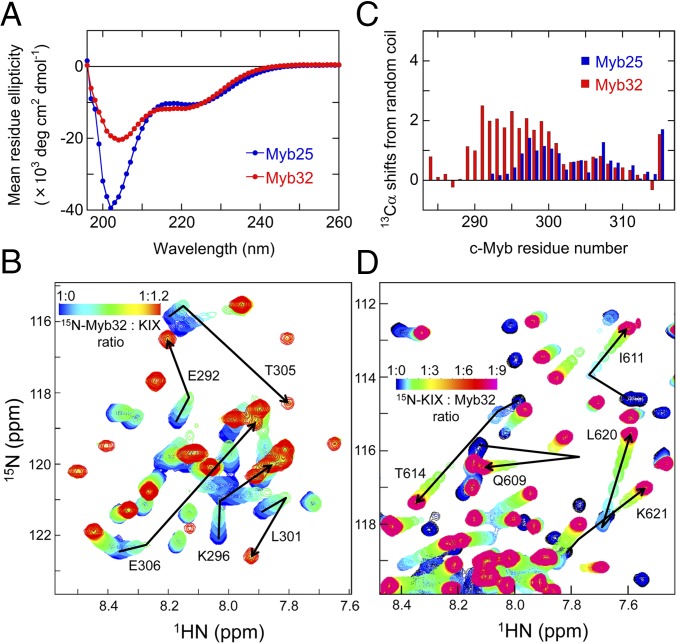
Fig. 1.
Conformational propensities of free c-Myb. (A) Far-UV CD spectra of free Myb32 (red) and Myb25 (blue). (B) Portion of a series of 1H-15N HSQC spectra of 15N-labeled Myb32 showing chemical shift changes upon titration with KIX. The cross-peak color changes gradually from blue (free) to red (bound) according to the concentration ratios shown. The complete spectrum is shown in Fig. S1. (C) Secondary 13Cα chemical shifts of free Myb32 (red) and Myb25 (blue). (D) Portion of a series of 1H-15N HSQC spectra of 15N-labeled KIX showing chemical shift changes upon titration with Myb32. The cross-peak color changes gradually from black (free) to magenta (bound) according to the concentration ratios shown. The complete spectrum is shown in Fig. S1.

