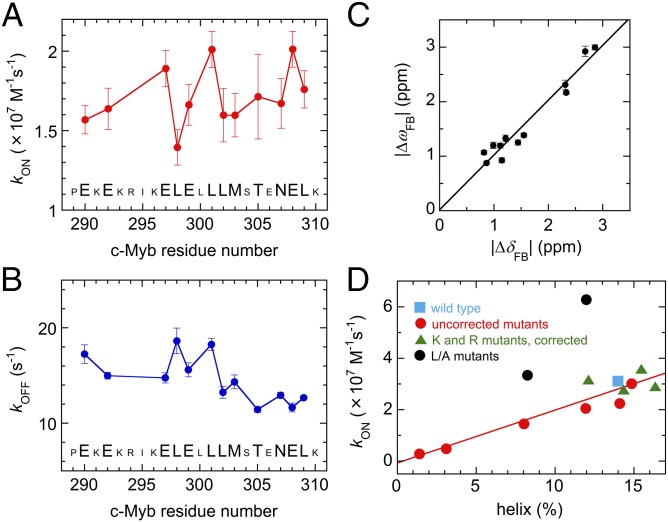
Fig. 5.
Kinetic and structural parameters derived from relaxation dispersion experiments. (A and B) kON (A) and kOFF (B) for c-Myb residues, obtained by fitting to the two-state model. Large characters indicate the 12 residues used in global analysis of the dispersion curves. Error bars show fitting errors. (C) Correlation of 15N chemical shift differences (ΔωFB) for Myb32 determined by fitting the dispersion curves to the two-state model with equilibrium 15N chemical shift differences (ΔδFB) between free Myb32 and the KIX-bound form in the presence of MLL28. The linear regression line (slope = 1.01, y intercept = 0.02, correlation coefficient r = 0.97) is shown. (D) Correlation between the association rate for binding of c-Myb mutants to KIX [data taken from Giri et al. (27)] and the intrinsic population of helix between residues 293 and 303 in the mutant Myb25 peptides predicted by AGADIR (22). Full details are given in SI Text.

