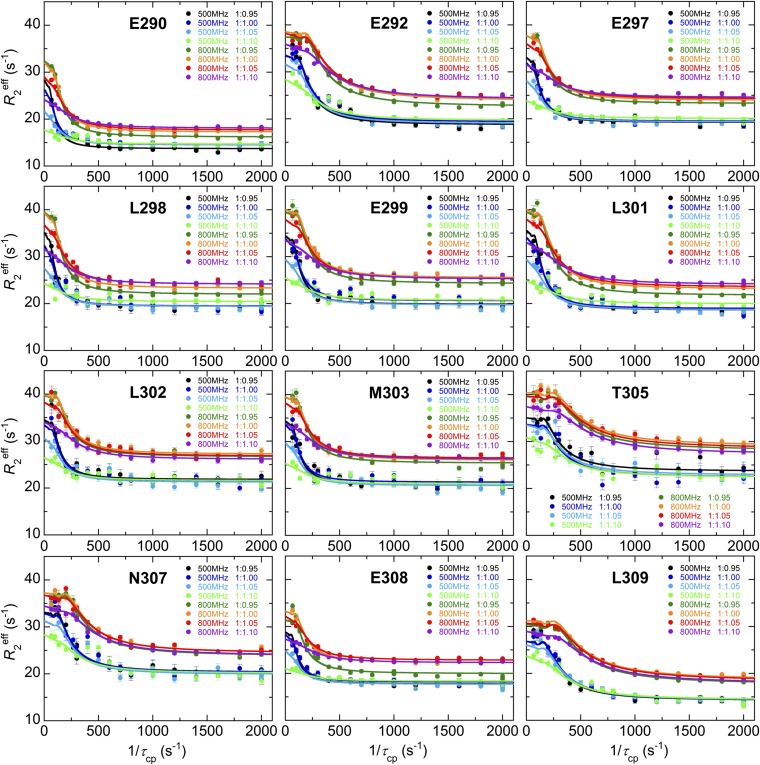
Fig. S6.
15N R2 relaxation dispersion curves for 12 residues of 15N-Myb32 in complex with KIX and MLL28 used for global analysis. In each panel, the Myb32:KIX concentration ratios and the color codes are shown. The MLL28 concentration was twofold excess of the KIX concentration. Solid lines are the fits to the two-state binding model.

