Fig. 1.
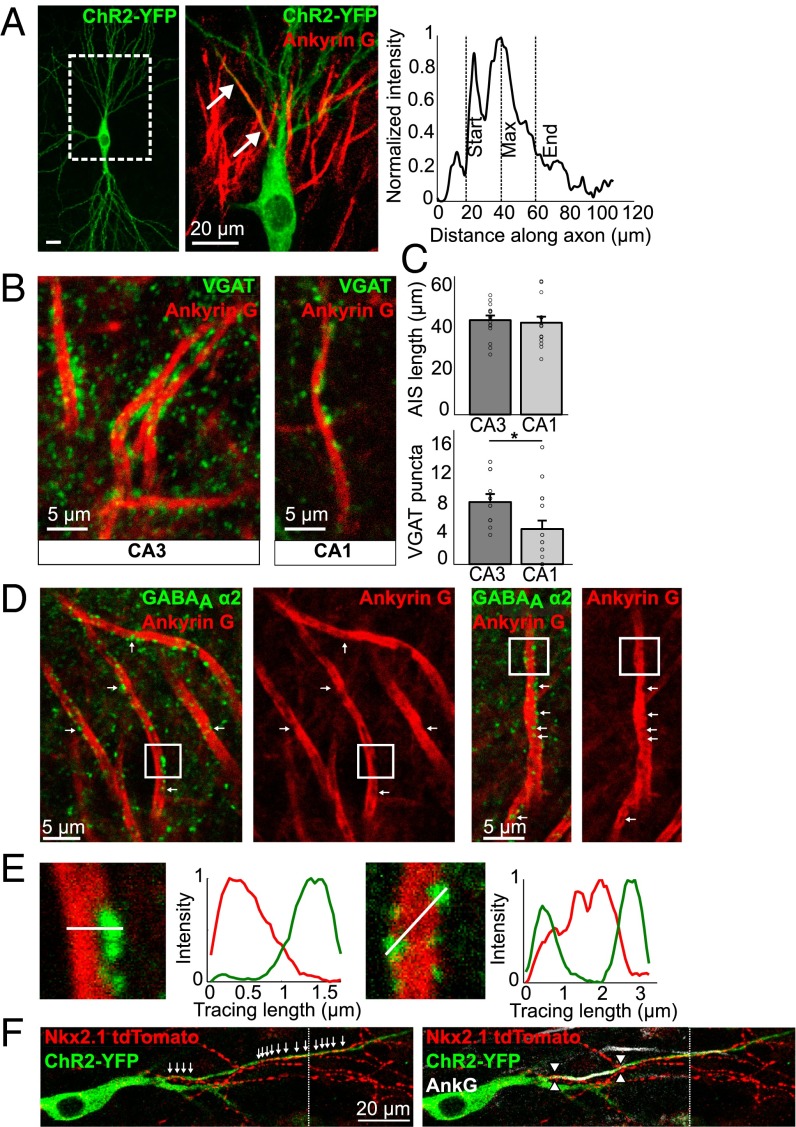
Axo-axonic synapses in organotypic hippocampal slices. (A) A ChR2-transfected CA3 pyramidal neuron, stained with AnkG (magnification). Start, maximum, and end position of the AIS was determined using the fluorescent intensity of the AnkG label along the axonal process. (Scale bar, Left: 20 μm.) (B) VGAT and AnkG staining in the CA3 and CA1 regions of the hippocampus. (C) AIS length and number of VGAT puncta on AISs in the CA3 and CA1 regions (means ± SEM; *P < 0.05; n = 16 CA1; n = 17 for CA3 AIS length; n = 12 for CA3 puncta). (D) GABAAα2 and AnkG staining in the CA3 region. Arrows indicate apparent holes in the AnkG staining, filled with GABAaα2 puncta. (E) Magnification of boxed areas as shown in D. Fluorescent intensity traces were taken through AIS and puncta as indicated by the white lines. (Scale bars, 20 μm.) (F) CA3 pyramidal neuron expressing ChR2-YFP in Nkx2.1CreER::Ai9 mouse showing chandelier cell boutons along its axon (arrows). AIS position is marked with arrowheads (Right). Dotted vertical line indicates image concatenation.

