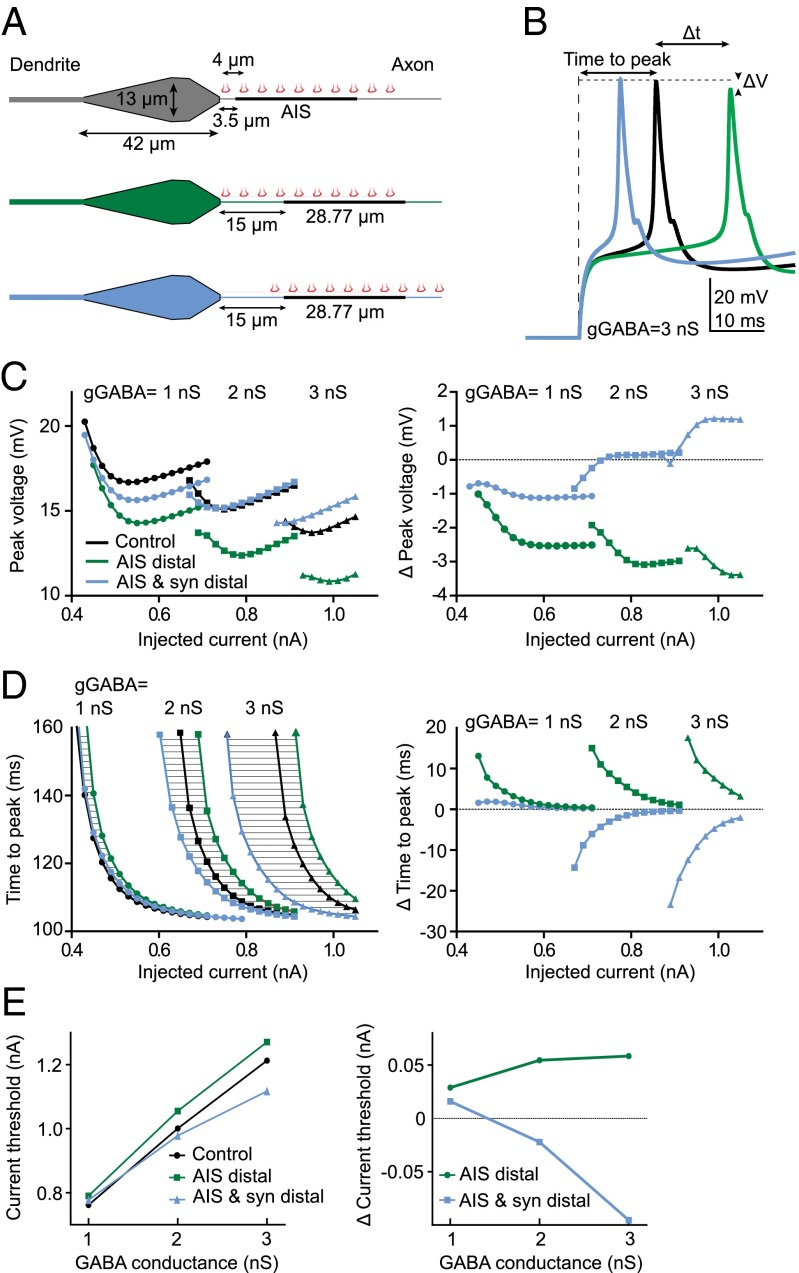
Fig. 3.
Computational model examining the effect of axo-axonic synapse position on APs. (A) GABAergic synapses were evenly spaced along the axon starting at 2 μm from the soma in the control and “AIS distal” scenario. In the third scenario the synapses were displaced distally together with the AIS. (B) APs elicited by a current pulse in the three scenarios. (C) Peak AP voltage (Left) and difference in peak voltage compared with control (Right), for varying GABAAR conductance. (D) Time to AP peak (Left) and difference in time to peak compared with control (Right). (E) Current threshold in response to a short, 3-ms current injection (Left) and difference in current threshold compared with control (Right).

