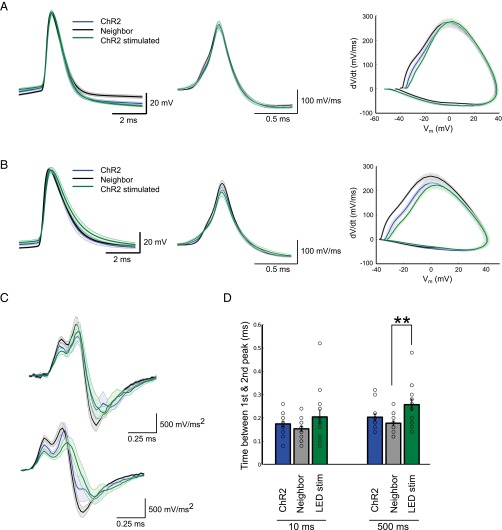
Fig. S5.
AP shape in stimulated and control CA1 pyramidal neurons. (A) Average AP trace (Left), first derivative (Center), and phase plot (Right) of the first AP elicited in response to 10-ms current injections at threshold. (B) Average AP trace (Left), first derivative (Center), and phase plot (Right) of the first AP elicited in response to 500-ms current injections. (C) Average second derivative of the first AP elicited in response to 10-ms (Upper) or 500-ms current injections (Lower). (D) Delay between the first and second peak in the second derivative of the AP waveform (means ± SEM; **P < 0.01; n = 14 ChR2 and ChR2-stimulated, n = 16 Neighbor).

