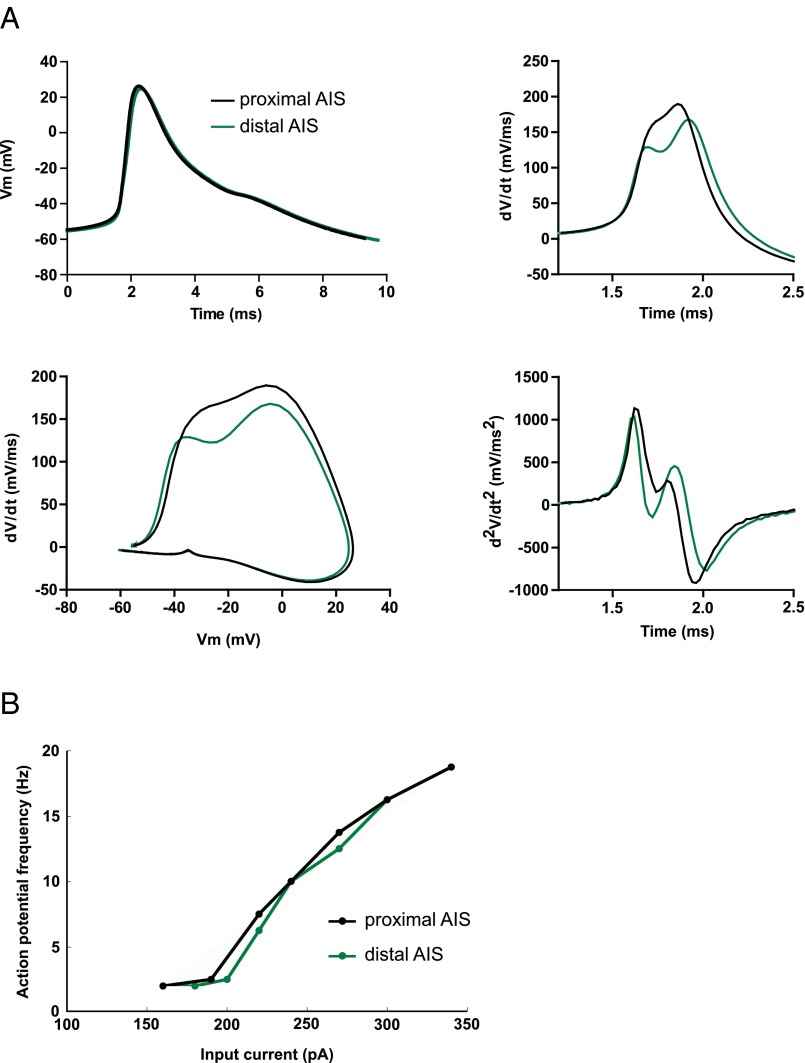
Fig. S6.
Characterization of AP output from the computational model. (A) AP waveform, its first derivative, phase plot, and second derivative in two different conditions: AIS proximal (AIS distance to soma 3.5 μm) and AIS distal (AIS distance 15 μm). (B) Input-output curve for the two different conditions as described for A, in response to an 800-ms current injection at the soma.

