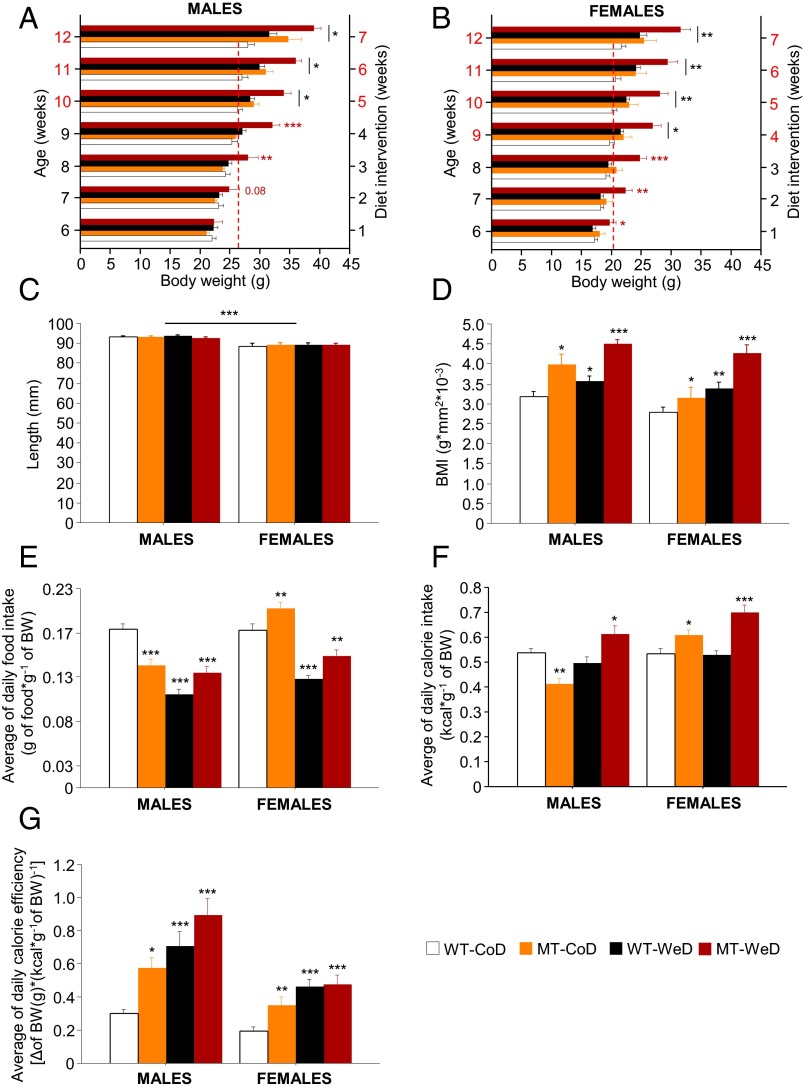
Fig. 1.
Overweight and impaired eating habits. (A and B) Monitoring of body weight. Compared with other groups, a significant increase in body weight is seen in male WeD-fed SNAP-25b–deficient MT mice after 3 wk of diet intervention (A) and in females after 1 wk of diet intervention (B). CoD-fed MT mice become significantly heavier than CoD-fed WT mice after 5 wk of the diet intervention in males (A) and after 4 wk in females (B), as indicated by red numbering on the y axes of A and B. Discontinuous red line in A and B marks the body weight of male (A) and female (B) WT-CoD mice at the time point of the diet study when all experimental groups became overweight. (C) Nose-tip to tail-root length was measured at the end of the 7-wk diet intervention and demonstrated no significant differences between experimental groups. (D) All experimental groups demonstrate a higher BMI than CoD-fed WT mice. (E) The average weight-matched daily food intake (grams of food consumed per gram of body weight) is significantly lower in male CoD-fed MT mice than in male CoD-fed WT mice, whereas female MT mice are hyperphagic. All animals on the CoD show a decrease in food ingested independent of genotype and sex. (F) Male CoD-fed MT mice exhibit lower calorie intake than CoD-fed WT mice but become hypercaloric when fed the WeD. Female CoD- or WeD-fed MT mice show a higher calorie intake than CoD-fed WT animals. (G) Average calorie efficiency is increased in all experimental groups compared with CoD-fed WT mice. *P < 0.05; **P < 0.01; ***P < 0.001 compared with CoD-fed WT mice. See also Figs. S2 and S3.

