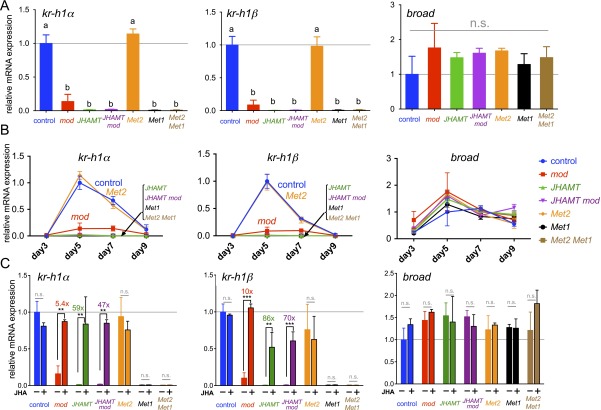
Fig. S6.
qRT-PCR of Kr-h1 and broad during embryonic stages. (A) Expression levels of Kr-h1α, Kr-h1β, and broad mRNAs on day 5 AO, at the presumed peak of the JHs. Total RNA and gDNA were extracted from the whole bodies of individuals, and samples with genotypes defined by PCR were used in the analysis (Materials and Methods). The values represent the mean + SD (n = 3–5) normalized against that of the control strain (set to 1). Means with different letters differ significantly (Tukey–Kramer test, P < 0.05; n.s., not significant). (B) Time-course analysis of the mRNA expression levels of Kr-h1α, Kr-h1β, and broad (on days 3, 5, 7, and 9 AO). Note the very low levels of Kr-h1 mRNAs in JHAMT, JHAMT mod, Met1, and Met2 Met1 mutants. The broad mRNA expression levels were comparable among the strains used. The values represent the mean + SD (n = 3–5) normalized against that of the control strain (set to 1). (C) Effects of methoprene treatment on gene expression. At day 4 AO, eggs were treated with 0.1 µg of methoprene (+) or the solvent alone (acetone) (−). Total RNAs were extracted from individuals 24 h after the treatment. The values represent the mean + SD (n = 3–5) normalized against the value of the control strain treated with acetone (set to 1). Values of the fold changes are indicated above the bars. Asterisks indicate significant differences compared with the control values according to the Student’s t test: **P < 0.01; ***P < 0.001. n.s., not significant.

