
Fig. 2.
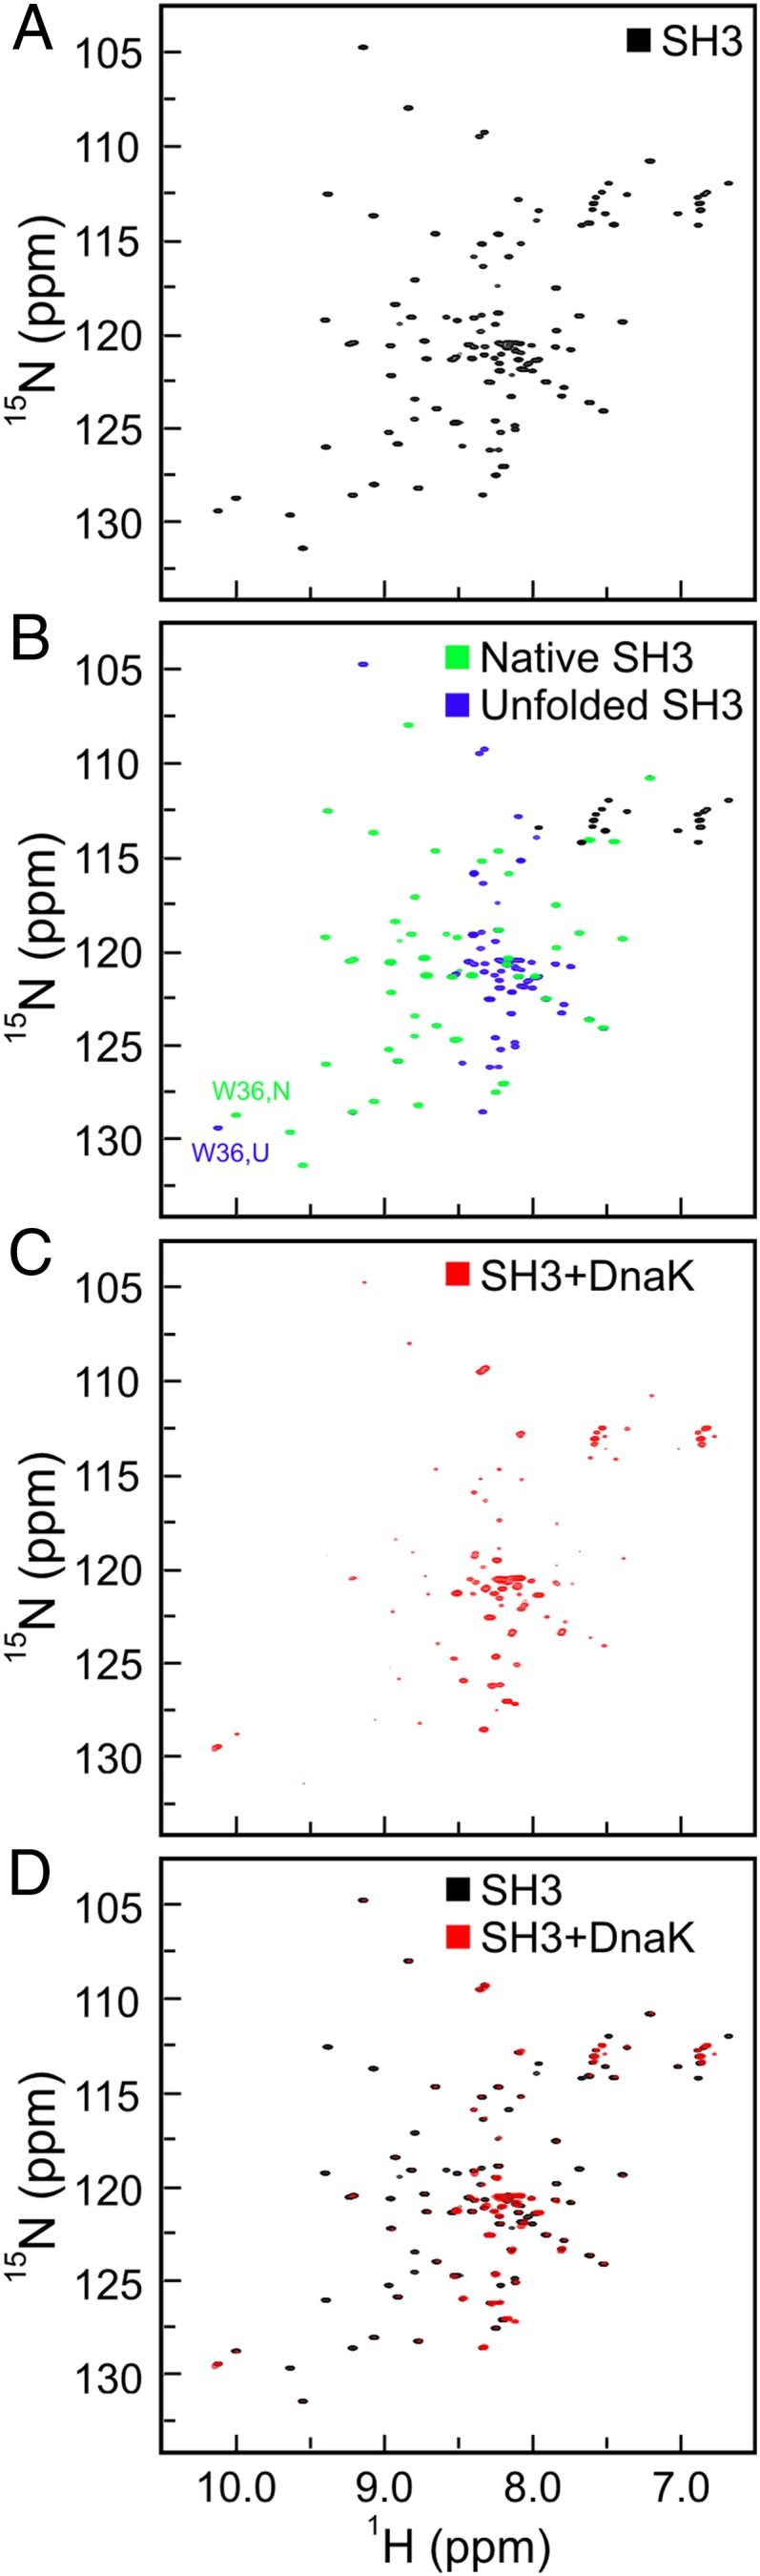
Addition of an excess of ADP-DnaK leads to dramatic spectral changes. (A) 1H-15N HSQC spectrum of 15N-13C–labeled SH3. (B) 1H-15N HSQC spectrum of SH3 as in A, with resonances corresponding to the native and unfolded species in green and purple, respectively. Side-chain resonances of Asp and Gln were not colored. (C) 1H-15N HSQC spectrum of a 1:4 ratio of SH3/ADP-DnaK, where only SH3 is isotopically enriched. (D) Overlaid spectra from both experiments. All samples were prepared in 50 mM Tris⋅HCl, 5 mM MgCl2, 50 mM KCl, 5 mM ADP, and 15 mM DTT in 95%:5% H2O/D2O. All spectral data were collected at 25 °C and pH 7.2, with eight scans and 256 increments over a sweep width of 1,937 Hz in the indirect dimension.