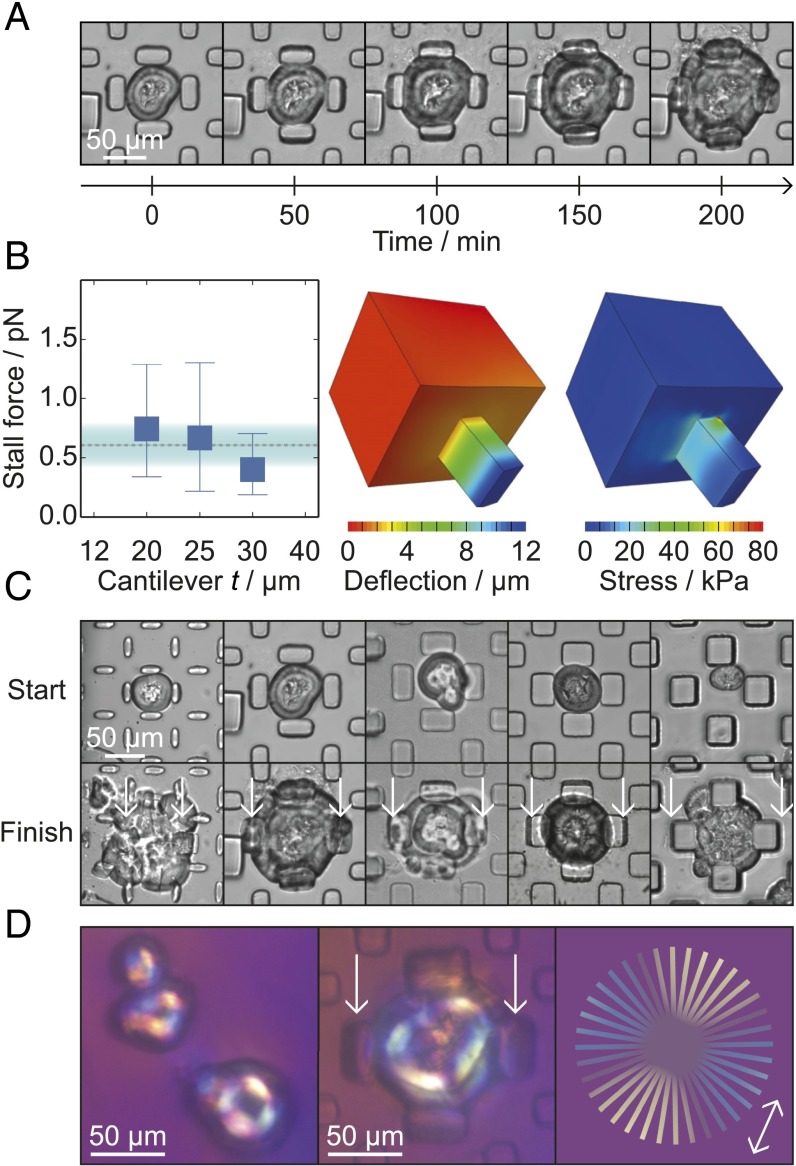
Fig. 2.
Microcantilever measurements. (A) Time course showing the gradual deflection of cantilevers with t = 20 μm. (B, Left) The force per fibril against cantilever depth, showing the mean and the range of forces measured for each value of t. For 20, 25, and 30 μm, the numbers of stall points measured were 15, 7, and 12, respectively. The mean force measured and the SD are shown by the dashed line and the shaded area. (Center) Schematic of a cantilever with t = 20 μm and δ = 11.8 μm as used in the finite element calculations. (Right) Diagram of the cantilever showing the local stresses calculated using the finite element method. (C) Images from the beginning (Top) and end (Bottom) of time courses with the five cantilever dimensions. (D) Images of spherulites placed between crossed polarizers and a wave plate. (Left) Preformed spherulites before injection into the microfluidic device. (Center) Trapped spherulite after incubation and growth between the cantilevers. (Right) Schematic figure showing the color of the polarized light depending on the orientation of the fibrils. The arrow indicates the orientation of the fast optical axis.

