Fig. 4.
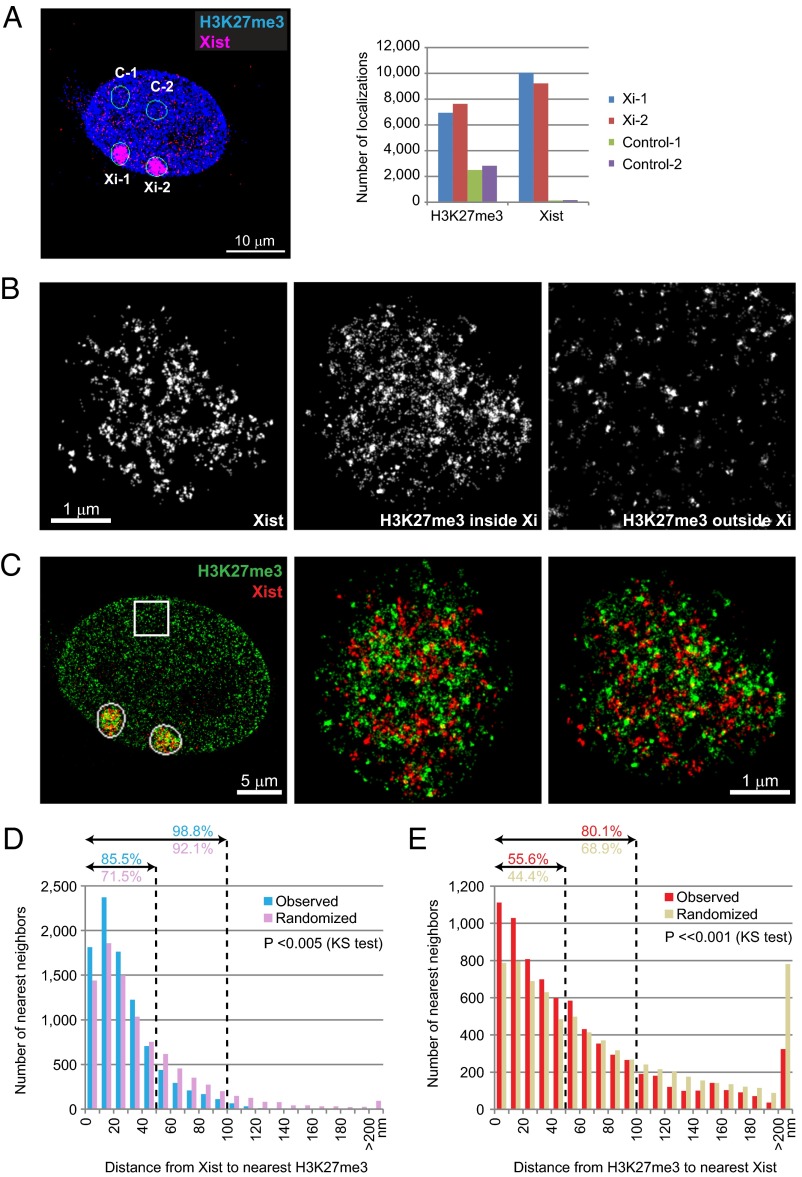
Relationship between Xist particles and H3K27me3 marks on the Xi. (A) H3K27me3 enrichment on the Xi. Numbers of localizations of H3K27me3 and Xist were plotted the Xi (Xi-1, Xi-2) versus control nucleoplasmic regions of same size and shape (C-1, C-2). H3K27me3 localizations were enriched ∼threefold on the Xi over nucleoplasm, whereas Xist localization is very specific. (B) High magnifications of images in C, rendered in black and white for visualization of contrast. H3K27me3 outside Xi is boxed area in C. (C) Color renditions of Xi-1 and Xi-2 showing the relationship between Xist RNA and H3K27me3 signals. (D and E) Distribution of nearest neighbor distances from Xist to the nearest H3K27me3 localization (D) or from H3K27me3 to the nearest Xist localization (E). The percentages (%) within 50- and 100-nm distances (dotted lines) are indicated. P values (KS test) for observed versus randomized distributions are shown in each plot.

