Fig. 6.
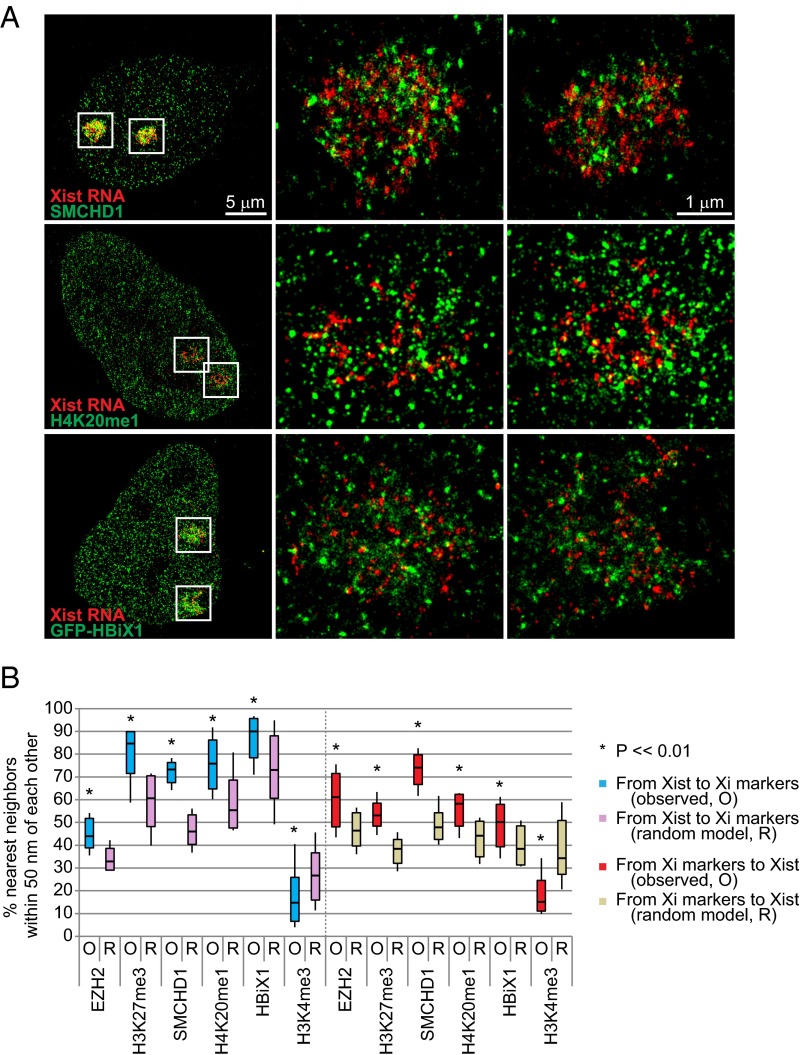
Association of Xist RNA with other Xi markers in MEFs. (A) STORM images of Xist RNA and SMCHD1 (Top), H4K20me1 (Middle), and GFP-HBiX1 (Bottom) in representative MEF cells. Two Xi territories are boxed and shown in at higher magnification in middle and right panels. (B) Summary of frequencies of Xist colocalization with several Xi markers. An active chromatin marker, H3K4me3 serves as a negative control. O, observed. R, random model. Boxes represent mean ± SD. Median is shown as a horizontal line within box. Vertical lines cover range of values. Student’s two-tailed t test: P <<0.01 for all pairwise combinations.

