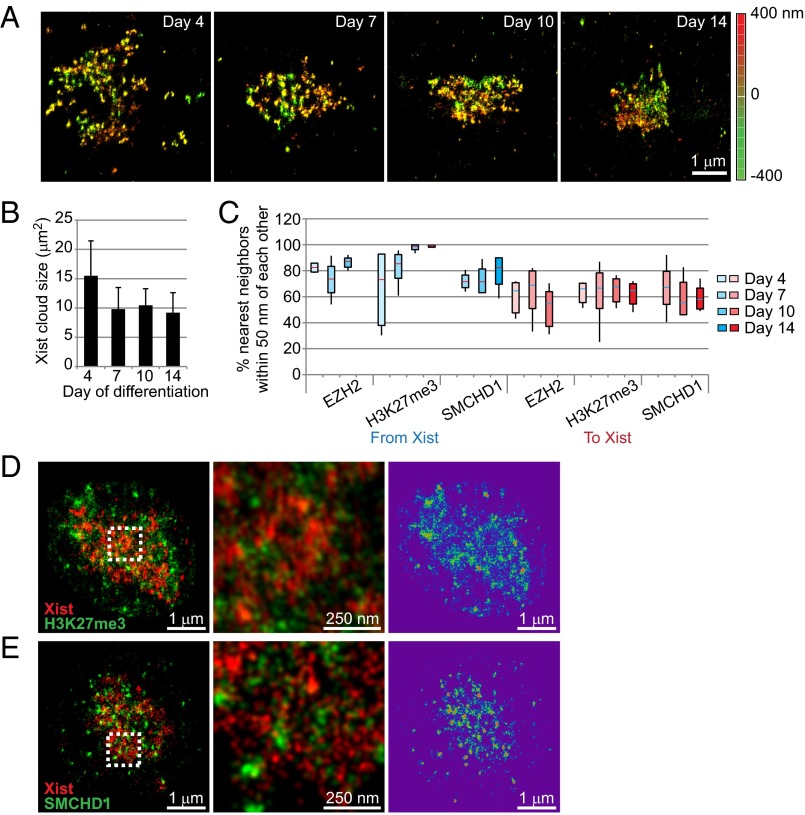
Fig. 7.
Organization of inactive X chromosome during differentiation of female ES cells. (A) 3D STORM of Xist RNA during ES cell differentiation from days 4–14. Depth in the z-plane is color-coded from red (+400 nm) to green (−400 nm). (B) The Xist cloud became compacted between days 4 and 7 of differentiation (error bar of SD). (C) Patterns of association with Xist RNA for three Xi markers (EZH2, H3K27me3, and SMCHD1) during ES cell differentiation. Boxes represent mean ± SD. Median is shown as a horizontal line within box. Vertical lines cover range of values. (D, Left) A representative STORM image of Xist (red) and H3K27me3 (green) from a day 14 ES cell is shown. (Center) Boxed area is shown at a higher magnification. (Right) H3K27me3 signals are shown in a rainbow map where red is most dense and purple is least dense. (E, Left) A representative STORM image of Xist (red) and SMCHD1 (green) from a day 14 ES cell is shown. (Center) Boxed area is shown at a higher magnification. (Right) H3K27me3 signals are shown in a rainbow map where red is most dense and purple is least dense.

