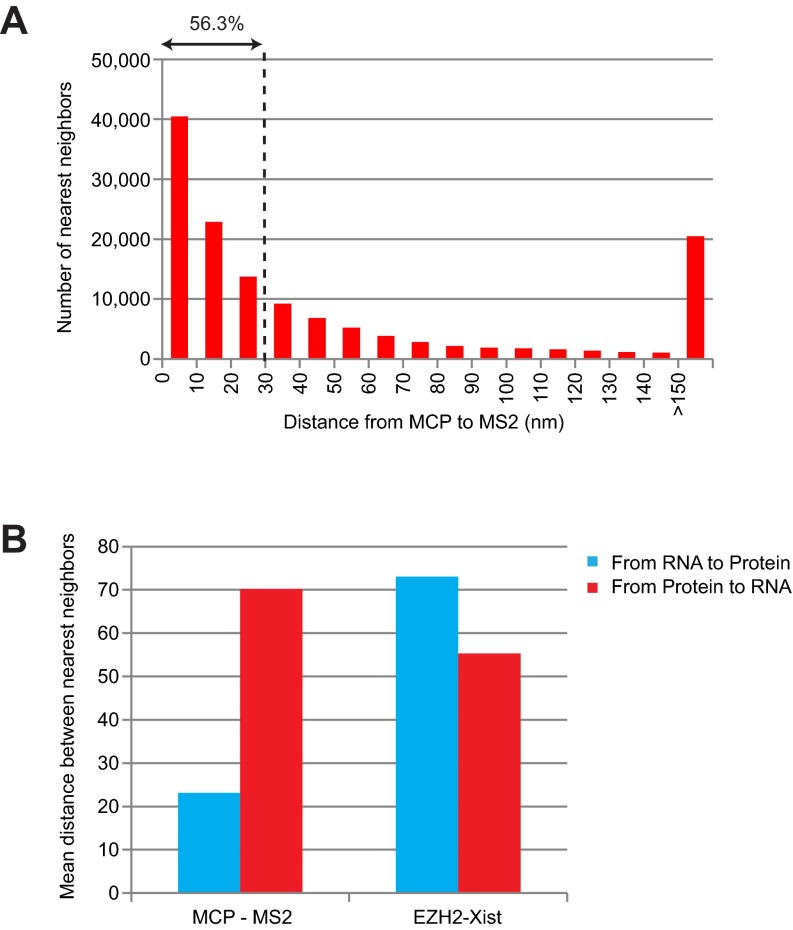
Fig. S4.
Potential artifacts created by averaging nearest neighbor distances. (A) Distribution of nearest neighbor distances from MCP to MS2 RNA for the cell in Fig. 2C. Note the nonnegligible number of pairs in the >150-nm bin, most likely due to excess MCP proteins (unbound to MS2). These outliers significantly skew the average distance, creating the false impression that MS2 and MCP are not colocalized. (B) Mean of nearest neighbor distances from MS2 to MCP (left, blue bar) indicates tight association between MS2 and MCP; the reciprocal analysis from MCP to MS2 suggests greater separation for the reason indicated above (unbound MCP). A similar pattern was observed with Xist-EZH2 associations (see also Fig. 3).

