Figure 4.
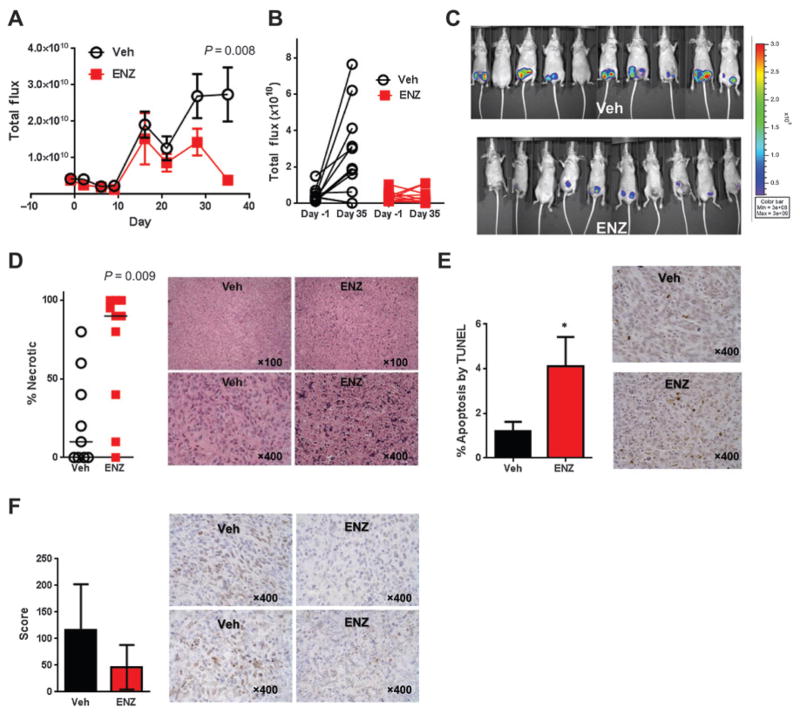
Enzalutamide (ENZ) decreases cellular viability and increases necrosis and apoptosis in SUM159PT xenografts. A, total flux growth curve of SUM159PT nude mice xenografts. Mice were randomized at day −1 and treatment was initiated on day 0. P value represents a 2-tailed t test comparing total flux between groups on day 35 and error bars represent SEM. B, change in total flux between randomization and day 35, by mouse. C, luminescent overlay of Veh and enzalutamide-treated mice. D, percent necrotic tissue by H&E staining. Horizontal bars represent median percentage necrotic tissue. P value represents a 2-tailed t test comparing percent necrosis between groups on day 35. Photomicrographs depict examples of tumor xenograft H&E staining showing viable tumor (Veh) and necrotic tumor (ENZ). E, TUNEL staining for apoptosis. Photomicrographs depict examples of TUNEL staining. F, AR nuclear score (score = intensity range 0 to 3× % positive) by IHC. Photomicrographs depict examples of AR staining in SUM159PT xenografts. *, P < 0.05; error bars, SEM.

