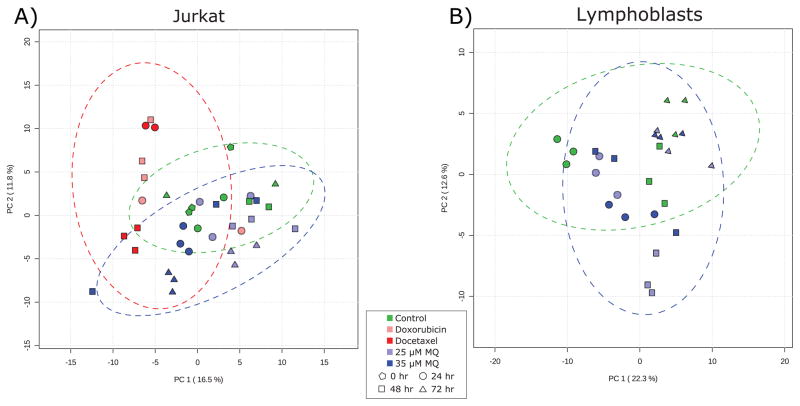
Fig. 3. Principal component analysis of (A) Jurkat and (B) lymphoblast metabolomics data.
(A) In Jurkat cells, the chemotherapeutic-treated samples (red) separate from the rest of the samples in the first principal component, while the later MQ-treated samples (when antiproliferative activity is at its highest; blue triangles) separate in the second principal component and are more similar to control samples than to chemotherapeutic samples. Two outlier samples miscluster and increase the confidence interval ellipses. (B) In lymphoblasts, there is little separation between control cells and the two treatment levels of MQ. At early time points when there is modest growth stimulation, the metabolite profiles diverge slightly, but by the end of the time course they are essentially identical. Green markers represent control samples, light blue represents 25 μM MQ treatment, dark blue represents 35 μM MQ treatment, dark red represents docetaxel treatment, and light red represents doxorubicin treatment. Pentagons represent 0 hour samples, circles represent 24 hour samples, squares represent 48 hour samples, and triangles represent 72 hour samples. Dotted lines represent 95% confidence intervals for individual classes.

