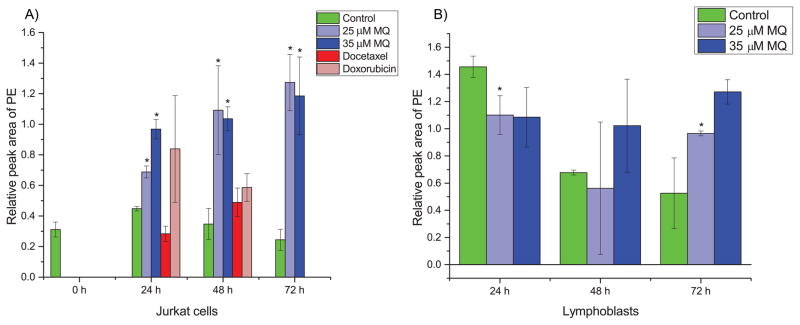
Fig. 4. PE levels in MQ-treated (A) Jurkat and (B) lymphoblast cells.

(A) PE is statistically significantly accumulated in MQ-treated Jurkat cells as early as 24 hours, with substantial accumulation by later times. Chemotherapeutic-treated cells show insignificant changes with slightly increasing trends much smaller than the magnitude of accumulation due to MQ treatment. (B) In lymphoblast cells, there is a suppression of PE levels at early time points due to MQ treatment, and at later time points usually insignificant changes with slightly increasing trends much less than the magnitude of accumulation in Jurkat cells. Error bars represent one standard deviation. Green bars represent control samples, light blue represents 25 μM MQ treatment, dark blue represents 35 μM MQ treatment, dark red represents docetaxel treatment, and light red represents doxorubicin treatment. * indicates statistical significance (p < 0.05, two tailed t-tests).
