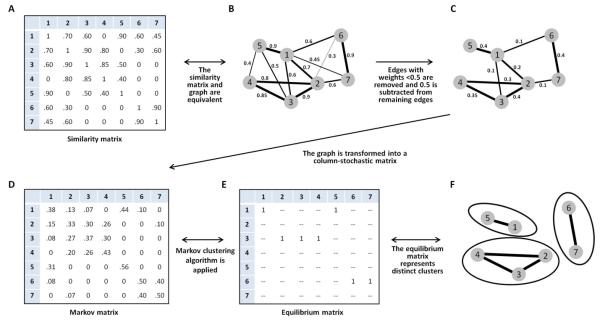
Figure 1. Schematic of the Markov clustering algorithm for a similarity matrix of 7 independent Structure runs.

(A) Similarity matrix, with the entry in a cell representing the similarity of the runs represented in the associated row and column. (B) A graph equivalent to the similarity matrix, with nodes representing runs and edges representing similarity scores for distinct pairs of runs (loops connecting nodes to themselves are not shown). (C) A graph following the removal of edges whose weights are smaller than a fixed threshold, 0.5. The weights of the remaining edges have been shifted by −0.5. (D) A column-stochastic matrix for the 7 runs. (E) The equilibrium matrix obtained by iterating expansion and inflation steps in the Markov clustering algorithm. (F) Clusters of runs identified by the Markov clustering algorithm.
