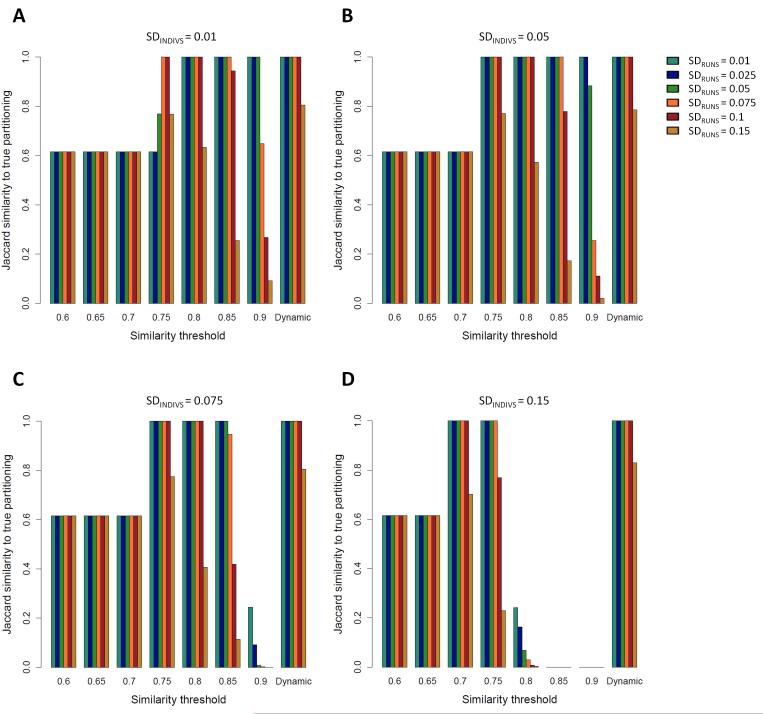
Figure 3. Jaccard similarity scores between the clustering solution obtained by Clumpak and the “true” (simulated) partitioning in a bimodal case, as a function of SDRUNS , SDINDIVS , and either a fixed threshold value or a dynamic threshold.
Simulations were carried out with a fraction f=0.25 of the runs assigned to the minor mode. Different colors represent different values of SDRUNS as given by the color palette on the right side of panel B. (A) SDINDIVS =0.01. (B) SDINDIVS =0.05. (C) SDINDIVS =0.075. (D) SDINDIVS =0.15.

