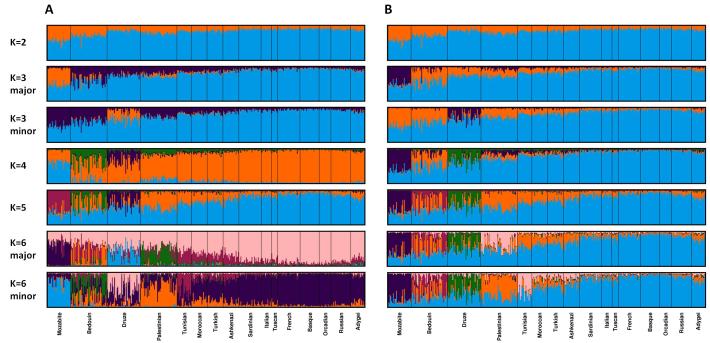
Figure 4. Major and minor modes identified for 399 individuals from 16 populations, illustrating Clumpak’s label-matching across K values.
For each K value, Structure was run 40 times. (A) Membership coefficients produced by Clumpak when label-matching across K values was disabled (for illustration only). (B) Membership coefficients produced by Clumpak for the same set of runs as in (A), matching labels across K values. Clusters have been permuted to sequentially match the configuration for the lowest K in the range (K=2).

