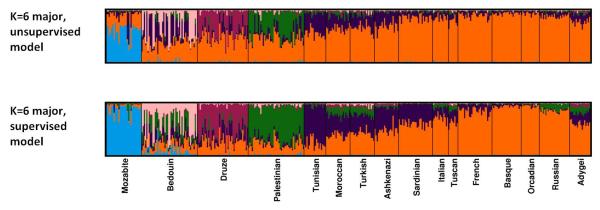
Figure 5. Membership coefficients compared using two different Structure models with K=6.

The same set of 399 individuals from 16 populations was used for both panels. For each model, Structure was run 40 times, and Clumpak was used to identify distinct solutions among runs of the same model as well as to compare the different modes across the two models. For the runs without the locprior model (unsupervised), the runs are the same as in Figure 4. Top: The major mode for the unsupervised admixture model without the locprior model. Bottom: The major mode for the locprior (supervised) admixture model.
