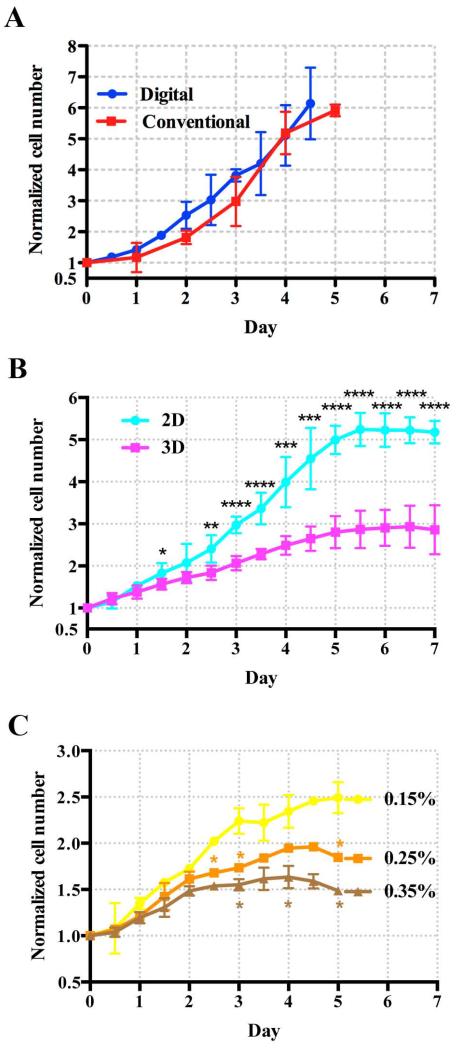
Figure 3. Growth Curves of MDA-MB-231.
Normalized cell number is defined as the cell density divided by the initial cell density. A: Validation of the 3D in situ cell counting method against the conventional hemocytometer. The dots are data points from 3D cell counting method, and the squares are from the hemocytometer. The solid lines are for visualization purpose. The cells were seeded on the 2D substrate of a 6-well plate, and the initial cell seeding density was 6,500 cells/cm2 in both cases. B: The growth rate of MDA-MB-231 cells in 3D cell culture with 0.15% collagen (squares) is reduced when compared with that in 2D planar culture (dots). Initial cell seeding density for 2D cell culture was 23,000 cells/cm2 and that for 3D cell culture was 1 million cells/mL; The inter-cell spacing was about 67 μm for 2D and 100 μm for 3D cell culture. C: The growth of MDA-MB-231 cells in 3D cell culture is reduced as the concentration of collagen increases. The collagen concentrations are 0.15% (dots), 0.25% (squares) and 0.35% (triangles) respectively. Student t-test was applied at each time point (*: 0.01<p<0.05, **: 0.001<p<0.01, ***: p<0.001, ****: p<0.0001).

