
Figure 6. Differential maturation of astrocyte uptake correlates with functional effects on neuronal NMDA currents.
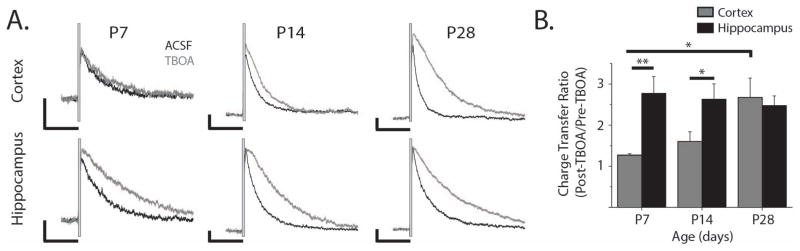
A. Representative NMDA receptor-mediated EPSCs evoked by 5 electrical stimulations 50 μs long at 100 Hz (stimulus artifacts blanked) in aCSF (black) and after wash-in of 100 μM TBOA (grey). Vertical scale bars are 50 pA, horizontal scale bars are 500 ms. B. Charge transfer ratio (calculated as the total integrated NMDAR-mediated EPSC after TBOA wash-in divided by the integrated EPSC before TBOA wash in) for cortical (grey bars) and hippocampal neurons (black bars) at P7 (nCor = 4, nHipp = 4 cells), P14 (nCor = 7, nHipp = 7 cells), and P28 (nCor = 7, nHipp= 3 cells). Error bars indicate SEM, *p<0.05, **p<0.01, two-sample t test.