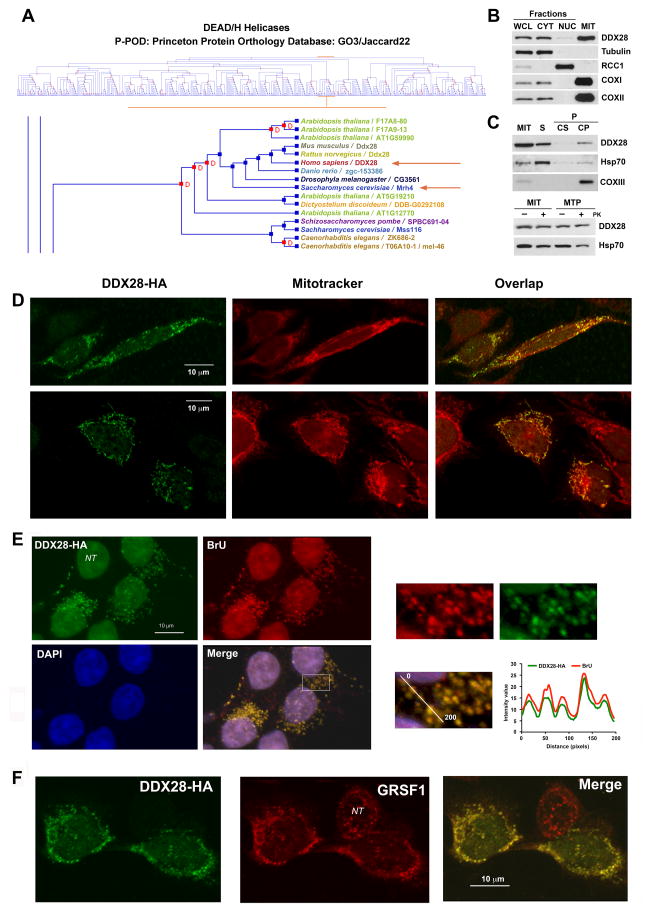
Figure 1. The Conserved Dead Box Protein DDX28 is Predominantly a Mitochondrial Matrix-Soluble Protein that accumulates in RNA granules.
(A) Cluster analysis of DEAD/H helicases highlighting the clustering of yeast Mrh4 and mammalian DDX28, obtained using the Princeton Protein Orthology Database (P-POD). A GO3/Jaccard22 graph is presented (http://ppod.princeton.edu) (Heinicke et al., 2007).
(B) Immunoblot analyses of DDX28 levels in HEK293T whole cell lysate (WCL), cytoplasmic (CYT) and nuclear (NUC) fractions as well as in isolated mitochondria (MIT). Antibodies against organelle-specific proteins were used as controls.
(C) Mitochondria isolated from HEK293T cells were fractionated into soluble (S) and membrane-bound (P) mitochondrial proteins by brief sonication and centrifugation. The pellet was submitted to alkaline extraction to allow the separation of the extrinsic proteins present in the supernatant (Cs) from the intrinsic proteins in the pellet (Cp). Equivalent volumes of each fraction were analyzed by immunoblotting using antibodies against DDX28, the matrix-soluble protein Hsp70 and the inner membrane intrinsic protein COXII. The lower panel represents a proteinase K protection assay in mitochondria (MIT) and mitoplasts (MTP) prepared by hypotonic swelling of mitochondria. The samples were analyzed by immunoblotting using antibodies against DDX28 and Hsp70.
(D–F) Immunofluorescence analysis of (D) HeLa cells with anti-DDX28 antibody and mito-tracker red to visualize the mitochondrial network. (E) Bromouridine-treated HEK293T cells with anti-HA and anti-bromouridine antibodies and DAPI to stain the nuclei. (F) HEK293T cells with anti-HA and anti-GRSF antibodies.
NT, non-transformed cell. In (A) and (C), the square marked in the “Merge” image was magnified and the graphs represent relative intensity of the fluorescence signal along the line in the magnified panel.
See also Figure S1.

