
Fig 4. RPGeNet visualization focusing on CRX, NRL and RHO partners.
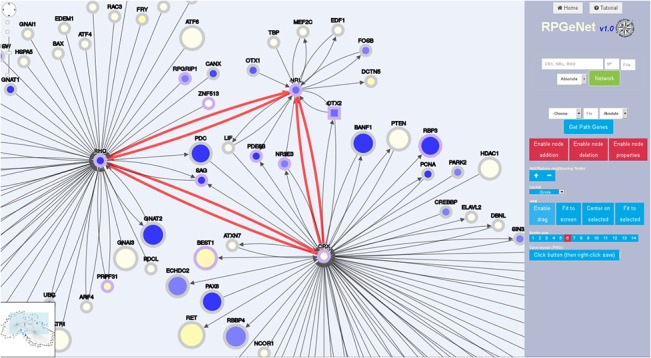
Snapshot of the customized network of interaction partners retrieved from RPGeNet when querying for CRX, NRL and RHO genes. This node distribution was derived from a basic circular layout, manually rearranged on the webapp by the researcher to underscore the relationships among those three genes. Neighbor nodes at distance 1 were requested upon the basic skeleton graph (level 0). The RP/LCA genes are highlighted by a light violet border in contrast to the grey colored non-RP genes, square nodes indicate syndromic RP/LCA genes. The node size is proportional to the number of variants in coding regions (neutral or mutagenic). The core color reflects the relative expression level in retina with respect to the average in all tissues, as calculated from the GEO GSE7905 dataset. The shades range from blue (over-expressed in retina) to yellow (under-expressed). Edges connecting the query RP/LCA genes were drawn in red, just taking advantage of the edge selection feature available from the webapp.