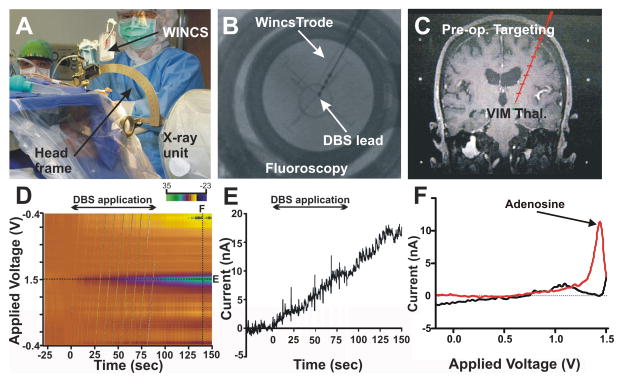
Figure 13.
Neurochemical changes evoked by DBS in the VIM of the thalamus in patients with essential tremor. (A) Surgical set-up. (B) X-ray of the position of the human CFM and DBS lead in patient’s thalamus. (C) MR image of implantation trajectory. (D) Color plot shows the appearance of oxidation current at +1.4V immediately upon application of DBS (135 Hz, 60 μsec pulse width, 0.5–2.0 V, slowly increased). (E) Current versus time plot at +1.4V following DBS. (F) Background subtracted cyclic voltammogram shows the oxidation peak of adenosine at +1.4 V.

