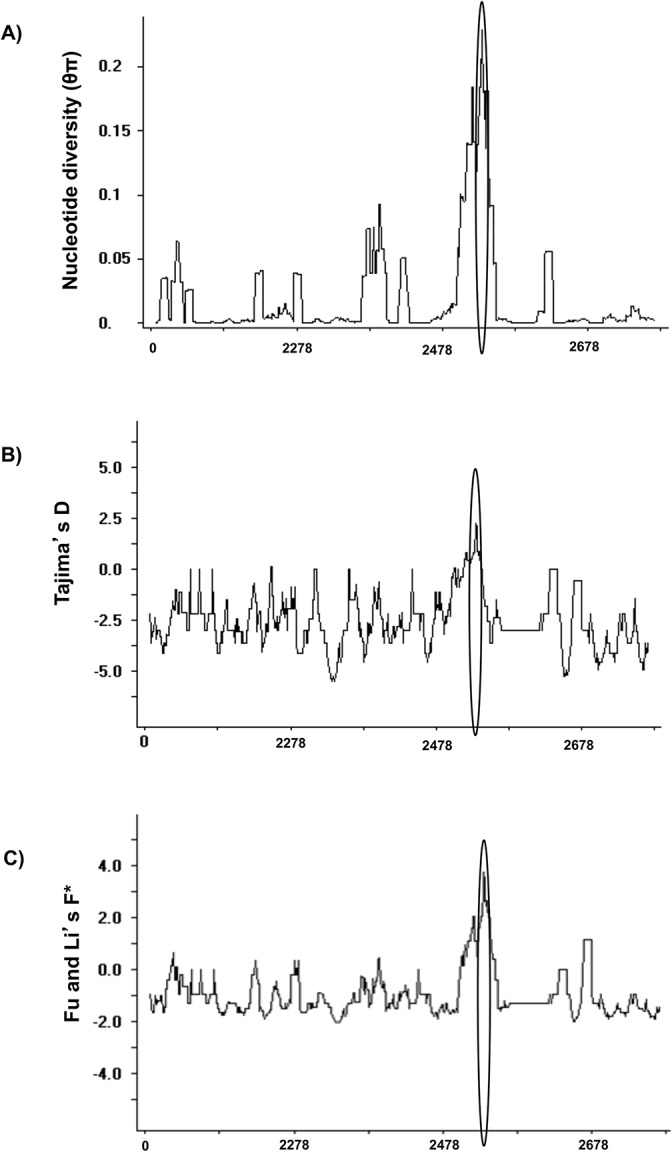
Fig 3. Sliding window plot analysis of nucleotide diversity and tests of selection on PvMSP3α block II in worldwide sequences.

(A) Average pairwise nucleotide diversity (θπ). (B) Tajima’s D values. (C) Fu & Li’s F* test values. A window size of 11 and step size of 1 bp were used. The region with the highest peak of significant values is circled.
