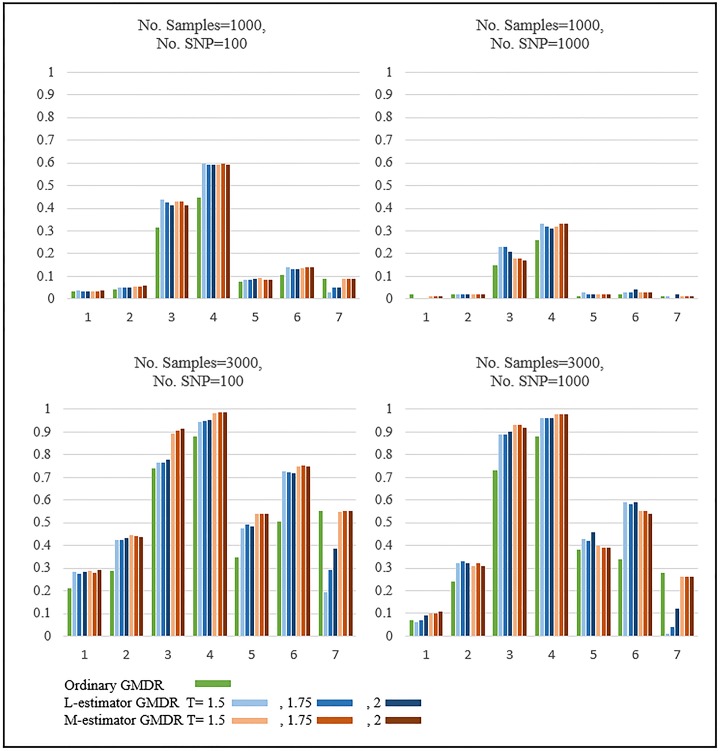
Fig 2. Results of Simulation: Normal distribution with MAF 0.1.
The upper figures show the results when the number of samples is equal to 1000 and the lower figures show the results when the number of samples equals 3,000. These four figures almost show the same patterns, but the simulation power is different.

