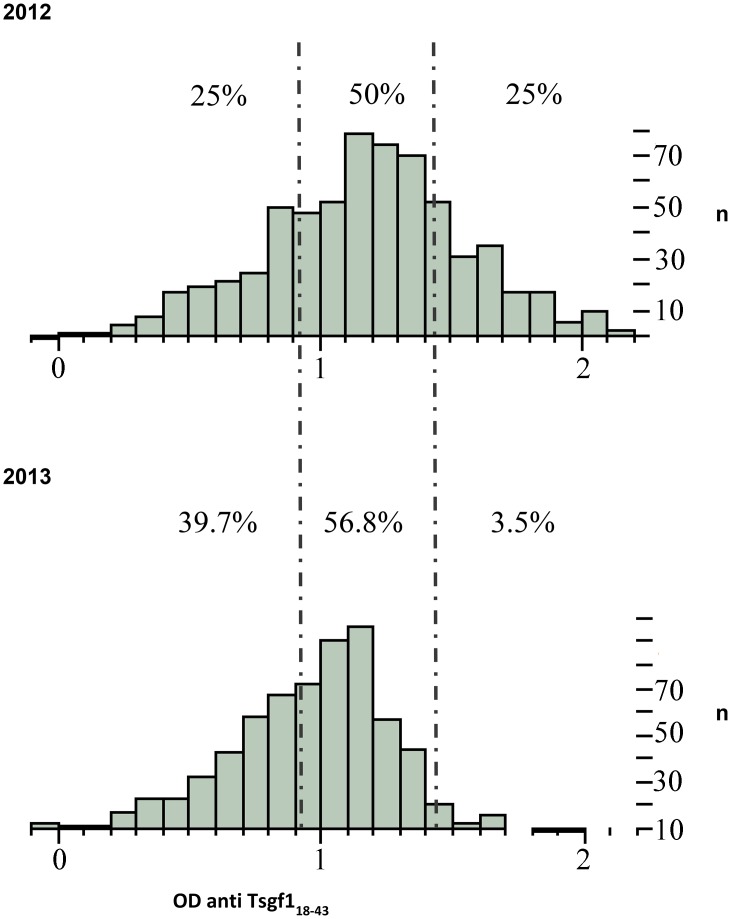
Fig 4. Histogram showing the changes of anti Tsgf18-43 IgGs responses in 2012 and 2013 in the vector control area (Boffa East).
Distributions of anti Tsgf18-43 Elisa optical densities obtained from 652 individuals in 2012 and 539 individuals in 2013 sampled in sentinel villages of the vector control area (Boffa East). Dashed lines represent the quartiles of the IgG response calculated in 2012.

