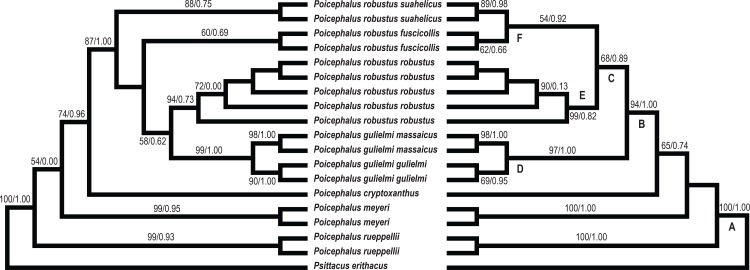
Fig 4. Maximum likelihood phylogeny retrieved of the Poicephalus specimens from the current study.
The analyses were performed using (left) concatenated data (COI, 16S rRNA and β-fib) and (right) mitochondrial DNA data. Values given above the branches represent maximum likelihood bootstrap values and Bayesian posterior probabilities (in that order). Dated nodes are indicated by numbers next to each node in b) and correspond to Table 2. Species/subspecies were highlighted according to the microsatellite clustering analyses. Psittacus erithacus was used as an outgroup.

