
Fig 3. Fasting (A) glucose and (B) bHB plasma concentrations in young (D90) and ageing (D456) adult mice.
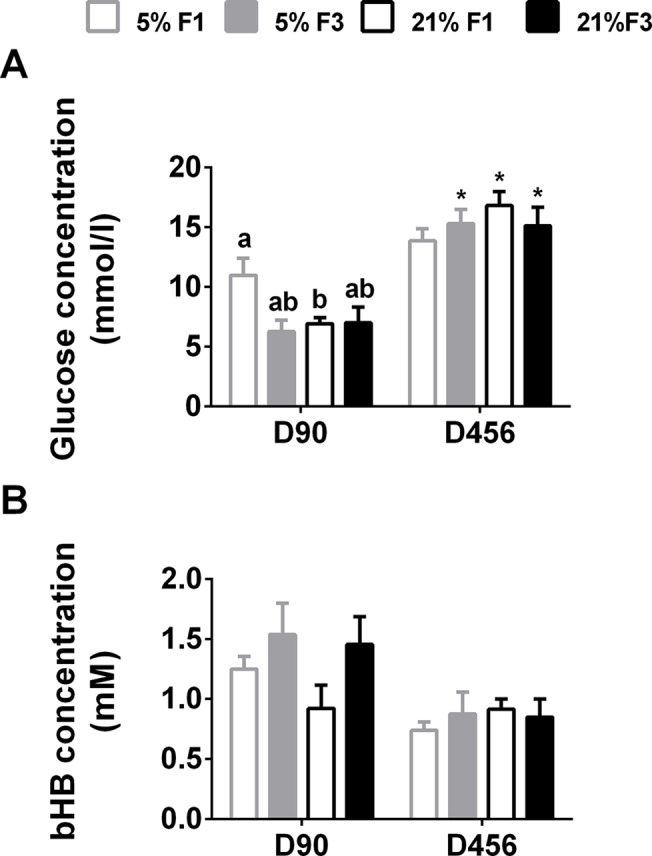
Values are mean ± SEM (n = 5 to 7 per dietary group per generation). Statistical comparison between groups, within each age, was carried out by ANOVA with diet and generation as fixed factors, with LSD post hoc correction. Means with different letters differ significantly (P < 0.05). *Means significantly different (P<0.05) between D456 and D90, determined by Student’s unpaired t-test (P<0.05).