
Fig 2. Participants’ responses to various statements.
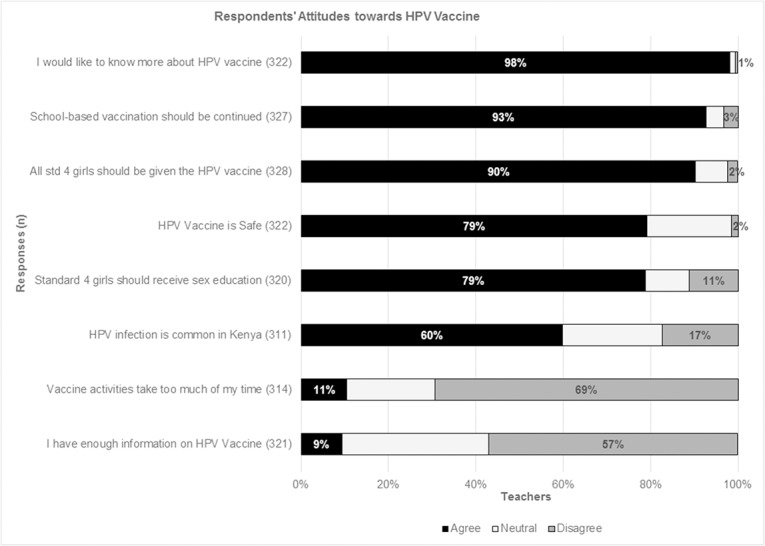
Shows participants’ responses on a Likert scale: The black color represents those who ‘agreed’, the light grey color represents the proportion who were ‘neutral’ and the dark grey represents those who ‘disagreed’ with the statement.