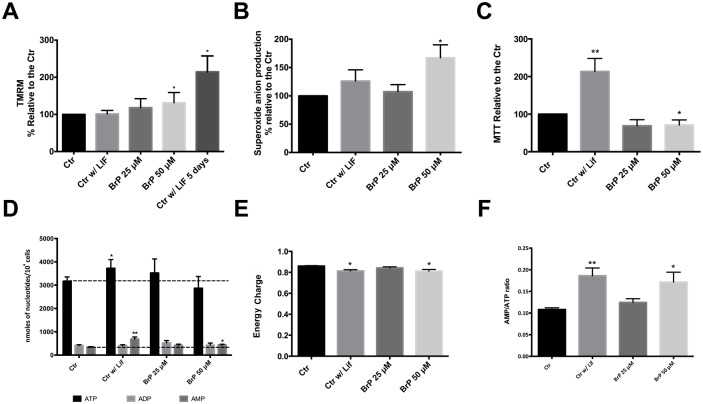
Fig 2. Assessing 3BrP effects on mitochondrial function.
ESCs were maintained in control conditions (with LIF), in the absence of LIF (differentiation control) and in the presence of two different 3BrP concentrations (25 and 50 μM) plus LIF. For each flow cytometry experiment results were analyzed in terms of Geometric Mean of Fluorescence for 20000 cells for each condition and are represented as percentage relative to the control. A)- Quantification of mitochondrial membrane potential (MMP) potential using TMRM; 4 independent experiments were performed. B)- Quantification of superoxide production using MitoSOX Red dye; 4 independent experiments performed. See also S1 Fig. C)- Results for the MTT assay are presented as percentage of formazan crystals relative to the control. Because the goal was to evaluate oxidative status MTT results were normalized for total cell number. A total of 10 independent experiments were performed. *p≤ 0.05, **p≤ 0.01. D)- Nucleotide levels determined by HPLC in 10 independent experiments. E)- Energy charge calculated as ([ATP] + 0.5×[ADP])/([ATP] + [ADP] + [AMP]). F)- AMP/ATP ratio n = 10.

