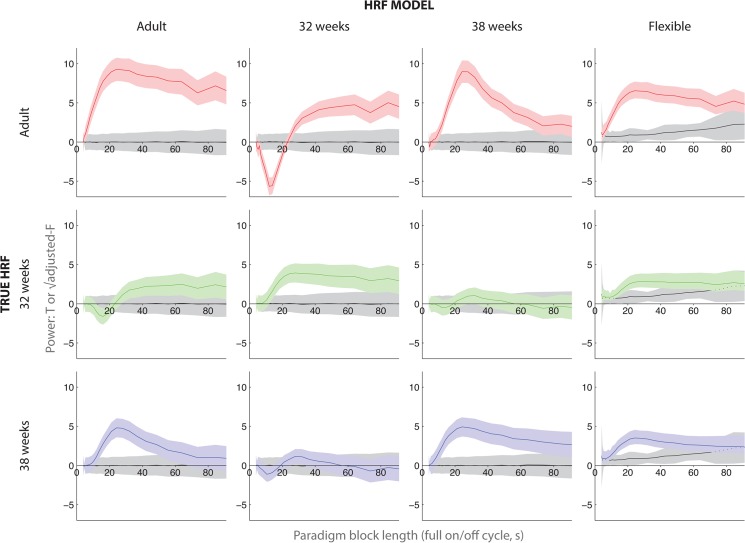
Fig 3. Simulation was used to assess the power of block designs varying in stimulation/rest cycle duration (x-axis of each subplot).
Higher values (y-axis of each subplot) correspond to greater statistical power. For example, in the top left subplot, peak statistical power was obtained with a block design of total cycle length 24 s (i.e., 12 s stimulation, then 12 rest). These calculations were repeated for matched or mismatched HRFs during analysis (three rows–true HRF used in simulation; four columns–HRF used for modeling). For the first three HRF columns, the SPM-T statistic is reported. For the flexible HRF model in the fourth column, the square root of an adjusted F statistic is displayed so that the corresponding p-value will match that of the T statistics. The mean +/- one standard deviation is shown. The grey bars show the distribution of fits to null data.

