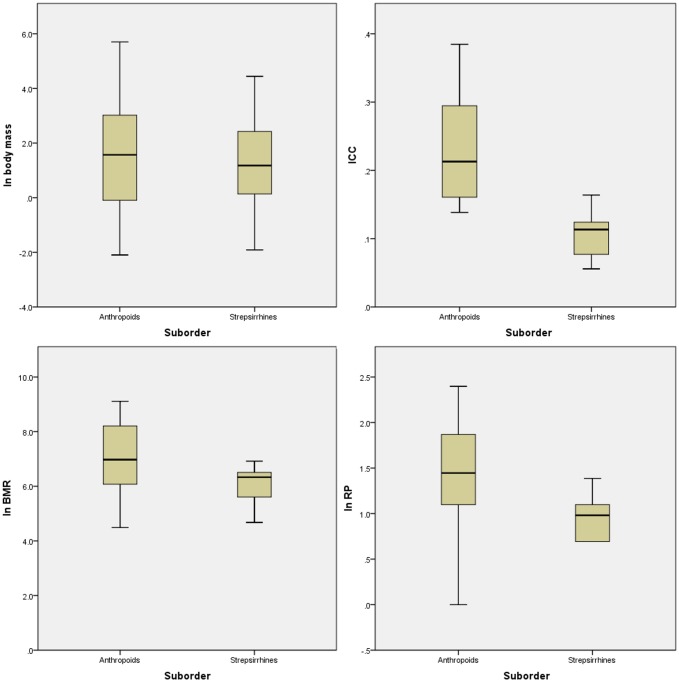
Fig 2. Variation of life-history related variables in strepsirrhines.
Standard boxplot demonstration of variation in ln body mass, basal metabolic rate (BMR), index of cranial capacity (ICC, see methods), and Retzius periodicity (RP) between the extant anthropoids and strepsirrhines sampled in this study. ICC is a measure of relative brain size, or encephalization, as opposed to ECV which measures absolute brain size; we have focused on encephalization in this chart to compare anthropoid and strepsirrhine brain size variation because absolute brain size covaries with body size. All plots are calculated using data in S2 Table (supporting information). Not all species for this study are included in all plots, as data for some species are missing for particular variables (especially BMR). S2 Table details which species had data available for them for the four variables.

