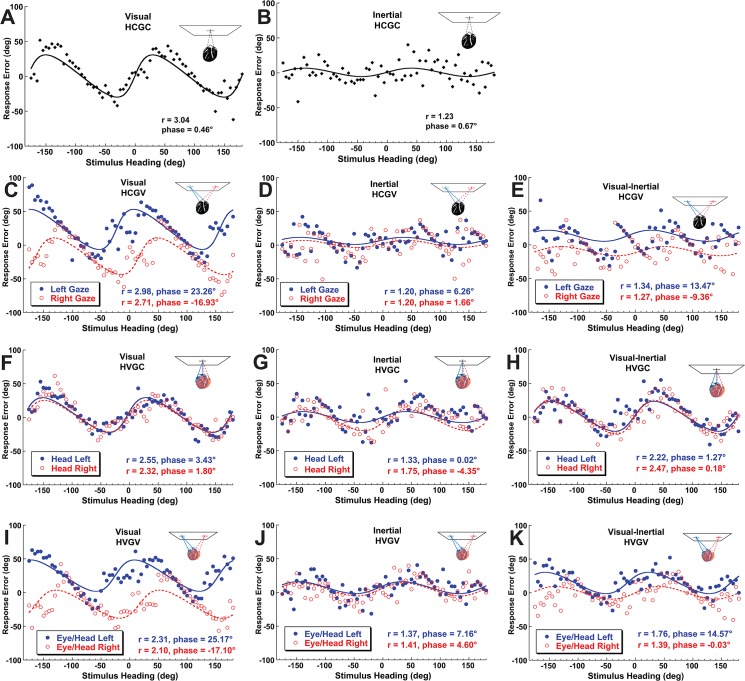
Fig 2. Sample data and model fits for a typical individual subject (#4).
The abscissa represents the stimulus heading. The ordinate represents the response error (perceived minus stimulus heading). Curves represent the best fit of the PVD model. Top row (A&B): The head centered gaze centered (HCGC) condition. Second row (panels C-E): The head centered gaze varied (HCGV) condition with gaze varied by ±28°. The gaze direction strongly influenced visual heading perception as indicated by the PVD model phase/offset parameter (φ). Third row (F-H): Head position varied over ±28° with gaze centered (HVGC). Inertial headings were independent of head position. Bottom row (I-K): Varying gaze and head yielded results similar to varying gaze alone (C-E).

