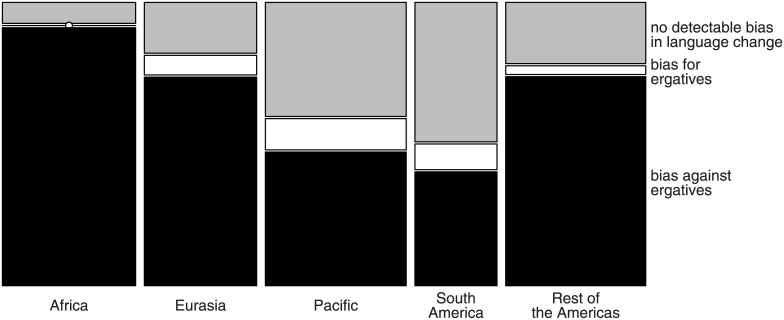
Fig 5. Grand-average of estimated evolutionary biases within families, across methods and taxonomies.
In each area, there are significantly more families that are estimated to be biased against the development or maintenance of ergatives (black tiles) than there are families that are estimated to be biased towards ergatives (white). Families without a bias (grey) provide no evidence on evolutionary biases in language change because they are compatible both with incipient developments towards ergatives or away from ergatives. Note: The sizes of tiles in the figure are proportional to the frequency of families tested (total N = 182).

