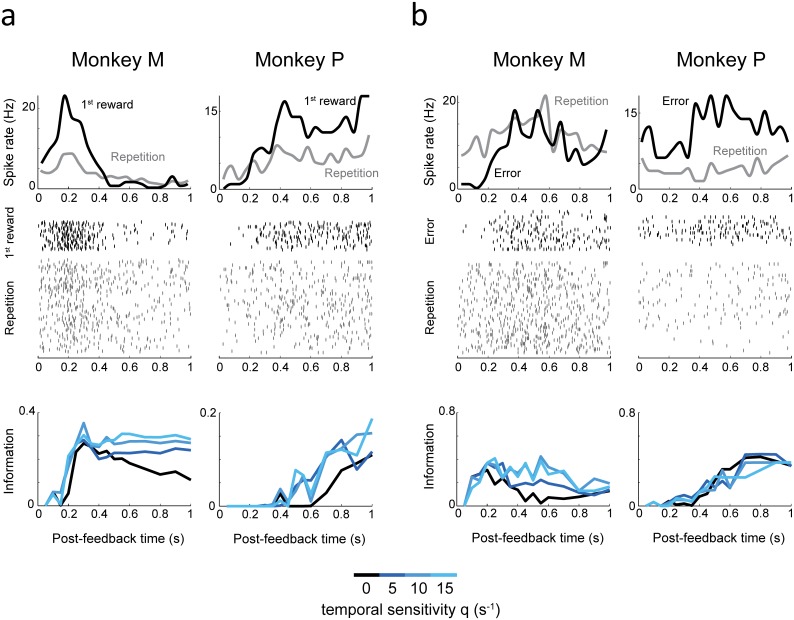
Fig 3. Examples of single-unit dACC activities decoded with different temporal sensitivities.
(a) Spike densities (top) and raster plots (middle) during first reward (black curve) and repetition (grey curve) task epochs. The classification performance between first reward and repetition spike trains (i.e., information) is shown in the bottom graphs, the time in the abscissa being the time at which the analysis window (and thus, the decoding process) ends. Two neurons, from the two monkeys, are shown. These samples show that temporal sensitivity can improve classification performance. (b) Same as (a) but for errors and repetition in two other neurons from the two monkeys.

